
Rapid Assessment Dashboard - Client Reference C63857
Banner (Dashboard Look)
Current Program: Q2 RAPID ASSESSMENT
Client ID: C63857
Survey: Rapid Assessment V012126
Population - P01
Run - R01
Date of run: Feb 2nd - Feb 18th, 2026
Risk Summary
We measured Psychological Health & Safety (PH&S) across 17 workplace conditions and Employee Mental Health Signals across six conditions. We also measured Measurement Readiness - the degree to which managers support this work.
The top three PH&S risk areas identified are Job Security & Stability, Trust in Leadership, and Respect by Leadership. Each of these workplace conditions influences how safe managers feel participating, communicating, and raising concerns.
The top three PH&S strength areas identified are Diverse and Inclusive Perspectives, Physical Safety and Proper Equipment, and Clear Reporting Pathways for Harassment, Bullying, and Discrimination - conditions that support inclusion, physical protection, and confidence in workplace response processes.
The top three Mental Health risk areas identified are Elevated Worry, Ongoing Stress, and Burnout Signals - indicating strain that can impact individual well-being while also shaping team dynamics, performance, and organizational risk exposure.
The top Mental Health strength areas identified are Lower Loneliness & Isolation and Lower Depression Signals - indicating areas where strain appears less pronounced overall, though not without outliers.
The Management Readiness signals indicated clear endorsement from managers to continue engaging in this work, reinforcing confidence in the initiative.
What follows is a detailed review of your organization’s exposure and strengths across these domains.
Executive Summary
Before we get into the details, here’s what stands out.
You have an engaged group of managers who believe this work matters. Sixty percent participated, and the Measurement Readiness Score tells us clearly that they support ongoing reflection around Psychological Health & Safety and Mental Health. This is encouraging and suggests that the initiative taken by executive leadership has been received seriously and respectfully.
The data also shows two truths at the same time. There are areas where the organization is steady, well structured, and resilient. There are also areas where pressure is high enough that it is likely influencing day-to-day experiences and operations. The data further indicates that some managers are experiencing mental health conditions at elevated levels. These levels are likely affecting individual wellness and may also be influencing organizational performance.
What is clear is that certain areas rise above others in terms of exposure. This framework is designed to help leadership focus attention where it is most likely to create measurable improvement.
This first phase of the framework provides clarity and insight. From here, leadership determines how to respond. Future phases of the framework support that decision with structure, focus, and the ability to measure progress over time.
Participation & Engagement
We received responses from 29 of 48 managers (60%), which included Directors, Program Managers, and Functional Leaders (We will use the term “Managers” and “Management Cohort” when referencing the population of managers who competed the survey).
This level of participation is strong and meaningful, particularly in light of the data suggesting that some managers may perceive speaking up as carrying risk.
Question 18, our measure of readiness for ongoing measurement and dialogue, registered at 88, which is a strong endorsement. In plain terms, managers believe it is important to continue measuring and discussing psychological health and safety and mental health.
That’s encouraging and suggests this group is prepared to engage in and support change.
Brief Introduction
The goal of this Rapid Assessment is simple: to bring clarity and direction — to understand where the system is steady, where pressure is building, and where leadership attention can make the greatest difference.
The data in this report connects workplace conditions (Psychological Health & Safety) with human capacity (Mental Health). Together, these factors influence how safely people communicate, how work gets done, how risks are surfaced and managed, and how consistently the organization performs and adapts over time.
This is not about labeling the organization or leadership as strong or weak. It is about identifying specific areas where small, deliberate adjustments can create measurable improvement.
Throughout this report, you will see both resilience and pressure.
How to Interpret the Results
Before reviewing the results, it’s helpful to know what this assessment actually measures.
Questions 1–17 examine workplace conditions that influence how safely people participate, communicate, learn, and perform - shaping trust, collaboration, decision quality, and overall organizational risk exposure. In this framework, these are referred to as psychological health & safety conditions. These items do not measure individual performance or personal attitudes; they reflect how workplace systems and leadership behaviours shape day-to-day conditions.
Questions 19–24 examine human capacity — what individuals are currently experiencing in terms of stress, burnout, anxiety, worry, loneliness & isolation, and depression. These are referred to as mental health signals, reflecting the human capacity within workplace conditions and influencing energy, attention, emotional regulation, communication, decision-making, interpersonal safety, learning behaviours, and the ability of individuals and teams to sustain performance, manage risk, and adapt over time.
Question 18 serves a different purpose. It measures readiness for ongoing measurement and dialogue — indicating managers’ readiness to continue structured measurement and improvement. This reflects governance, transparency, and openness to this work.
Together, environmental conditions and human capacity shape how safely people communicate, how work gets done, and how risks are surfaced, managed, and learned from.
The numbers you will see are baseline indicators. They indicate direction, not diagnosis. They show where agreement is strong, where disagreement is present, and where pressure is concentrated. In the next phase of the framework we engage in deeper examination of drivers and targeted intervention.
At this Rapid Assessment stage, the purpose is clarity and direction.
Organizational Baseline Snapshot
This section establishes the organizational starting point.
Across Questions 1–17, the Organizational PH&S Risk Level is 35 (out of 100).
This is the average of all responses across the PH&S questions, converted to a number out of 100 so it’s easier to read and track over time.
The Organizational PH&S Risk Indicator is 25%, meaning one in four managers are actively signaling concern by selecting Somewhat Disagree, Disagree, or Strongly Disagree on PH&S conditions.
We use both numbers together because one shows the overall response pattern, while the other shows the degree of responses signaling risk. Together, they create a clear baseline for measuring movement over time. While we want to see a reduction in both numbers, movement in the Risk Indicator is especially important, as this reflects fewer people experiencing conditions where workplace systems may begin to strain or break down.
Insert Full PH&S Table (simple table) here
Key Areas of Exposure and Stability
The following section examines the three most elevated areas of exposure and the three strongest areas of stability across both PH&S conditions and Mental Health Signals. It also considers the implications of these findings for business productivity, employee wellness, and risk mitigation.
We begin with the areas of highest exposure within Psychological Health & Safety. Note that PH&S Average Weighted Response reflects the overall weighted pattern of responses, converted to a number out of 100 for easier interpretation. PH&S Risk Indicator shows the proportion of people selecting Somewhat Disagree, Disagree, or Strongly Disagree — helping us see both the overall response pattern and the key signals of visible risk within the group.
Psychological Health & Safety - Top Three Areas of Exposure
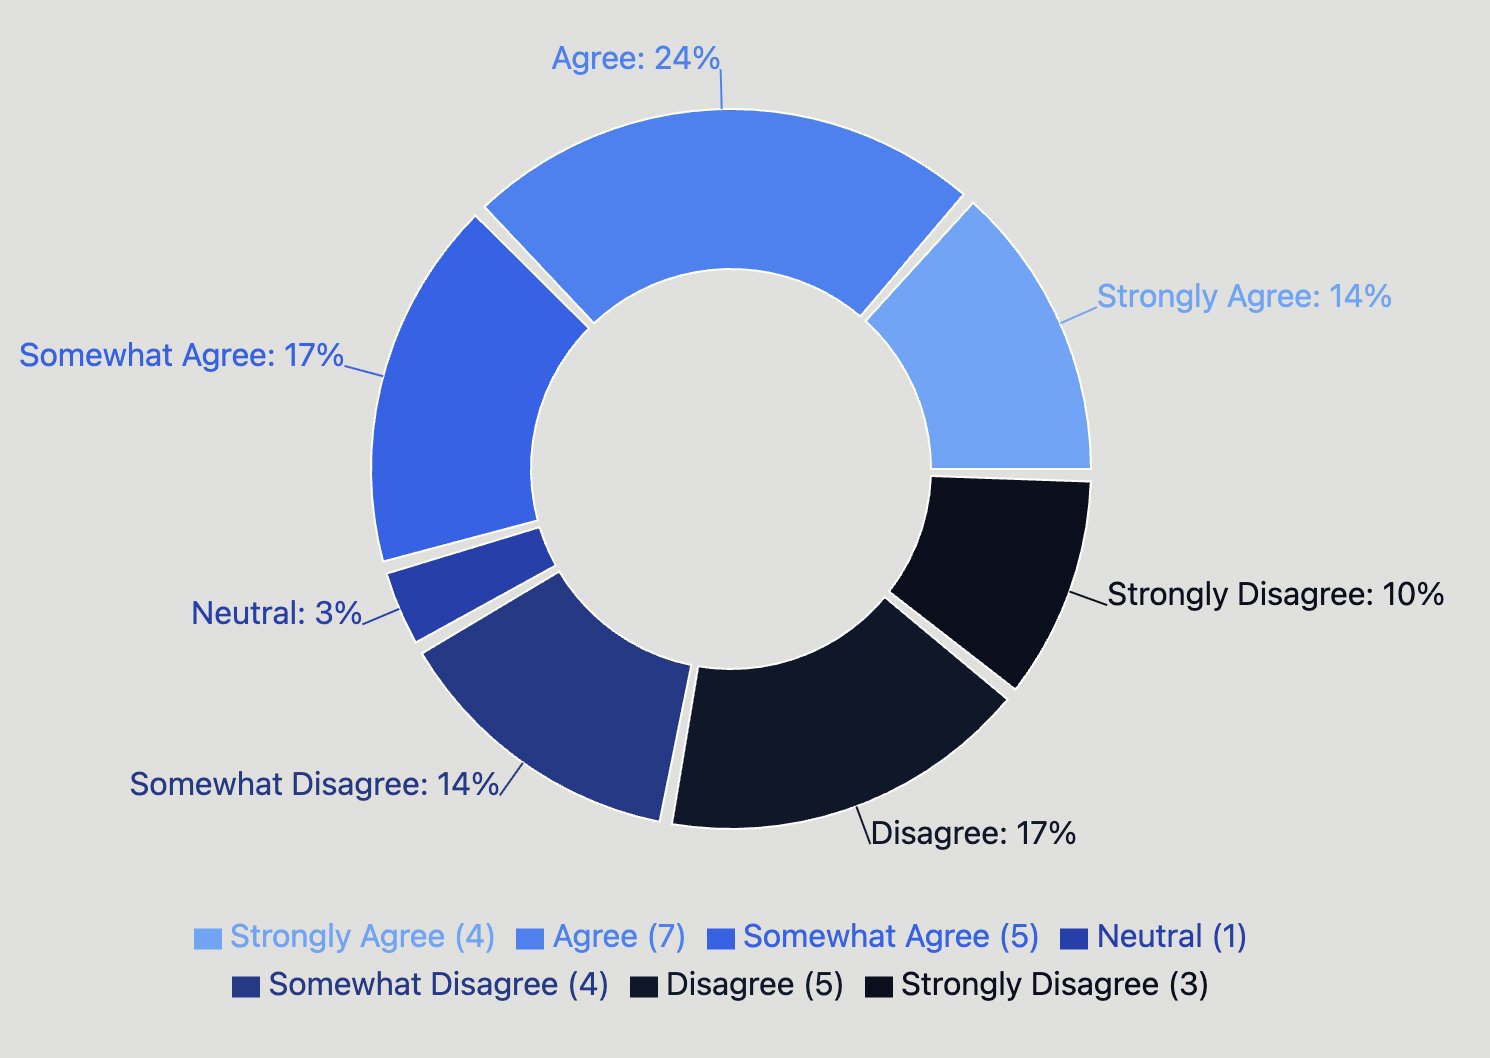
Job Security & Stability
“I feel that the security of my job remains stable from day to day, week to week, or year to year” (Q15)
PH&S Average Weighted Response: 50
PH&S Risk Indicator: 45%
Trust in Leadership
“I trust the leadership at my workplace” (Q2)
PH&S Average Weighted Response: 45
PH&S Risk Indicator: 41%
Respect by Leadership
“I feel respected by leadership at my workplace” (Q3)
PH&S Average Weighted Response: 42.5
PH&S Risk Indicator: 34%
*Average Weighted Response reflects overall severity across the full response distribution. Risk Indicator reflects the percentage selecting Somewhat Disagree / Disagree / Strongly Disagree.
Why this matters
Job Security & Stability, Trust in Leadership, and Respect by Leadership influence how safe managers feel communicating openly, raising concerns, and collaborating across the organization. When these conditions are under pressure, people often shift toward more cautious and protective behaviors — developing quiet workarounds, hesitating to share mistakes, and holding back ideas for improvement. Over time, this limits organizational learning, slows efficiencies, and can lead teams to repeat the same challenges rather than addressing them at the system level. Strengthening these areas supports clearer communication, earlier problem identification, and more sustainable team performance, while also strengthening risk mitigation by encouraging early reporting, reducing the likelihood of issues escalating into formal complaints or claims, and helping the organization demonstrate sound governance and due diligence alongside strong operational performance.
After reviewing areas of highest exposure, it is equally important to recognize where the system is demonstrating stability and strength.
Psychological Health & Safety — Top Three Areas of Stability
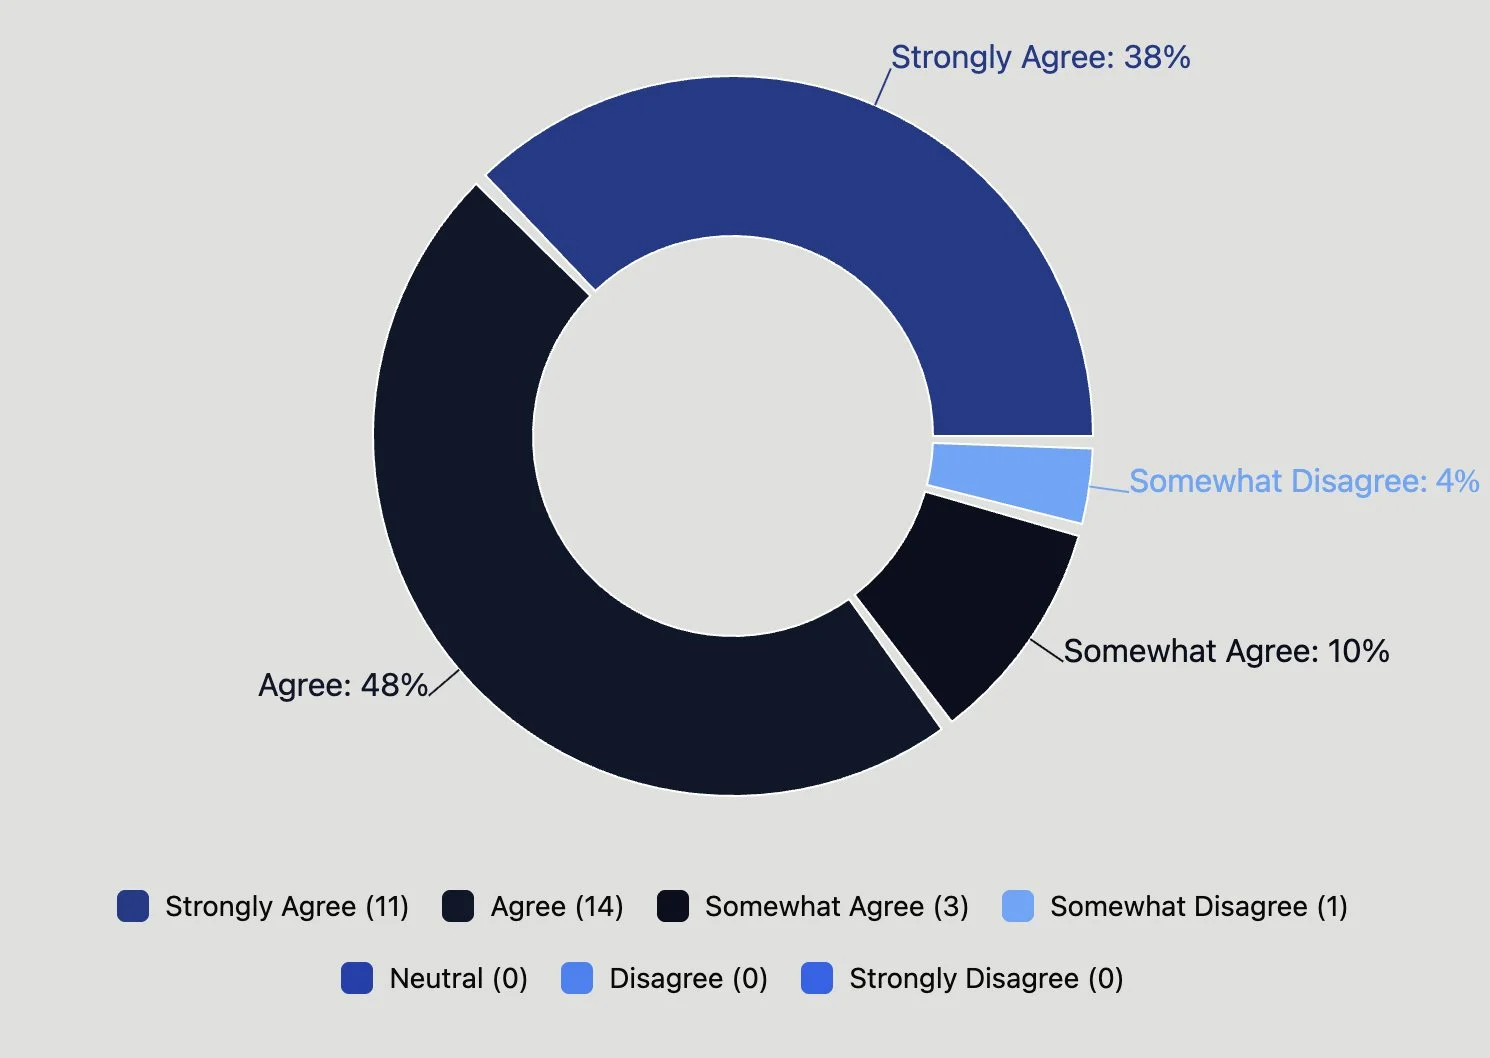
Physical Safety & Equipment Readiness
“My work environment is safe from physical hazards and I have adequate equipment (e.g. personal protective equipment, an ergonomic workspace) to do my job safely.”
PH&S Average Weighted Response: 23
PH&S Risk Indicator: 7%
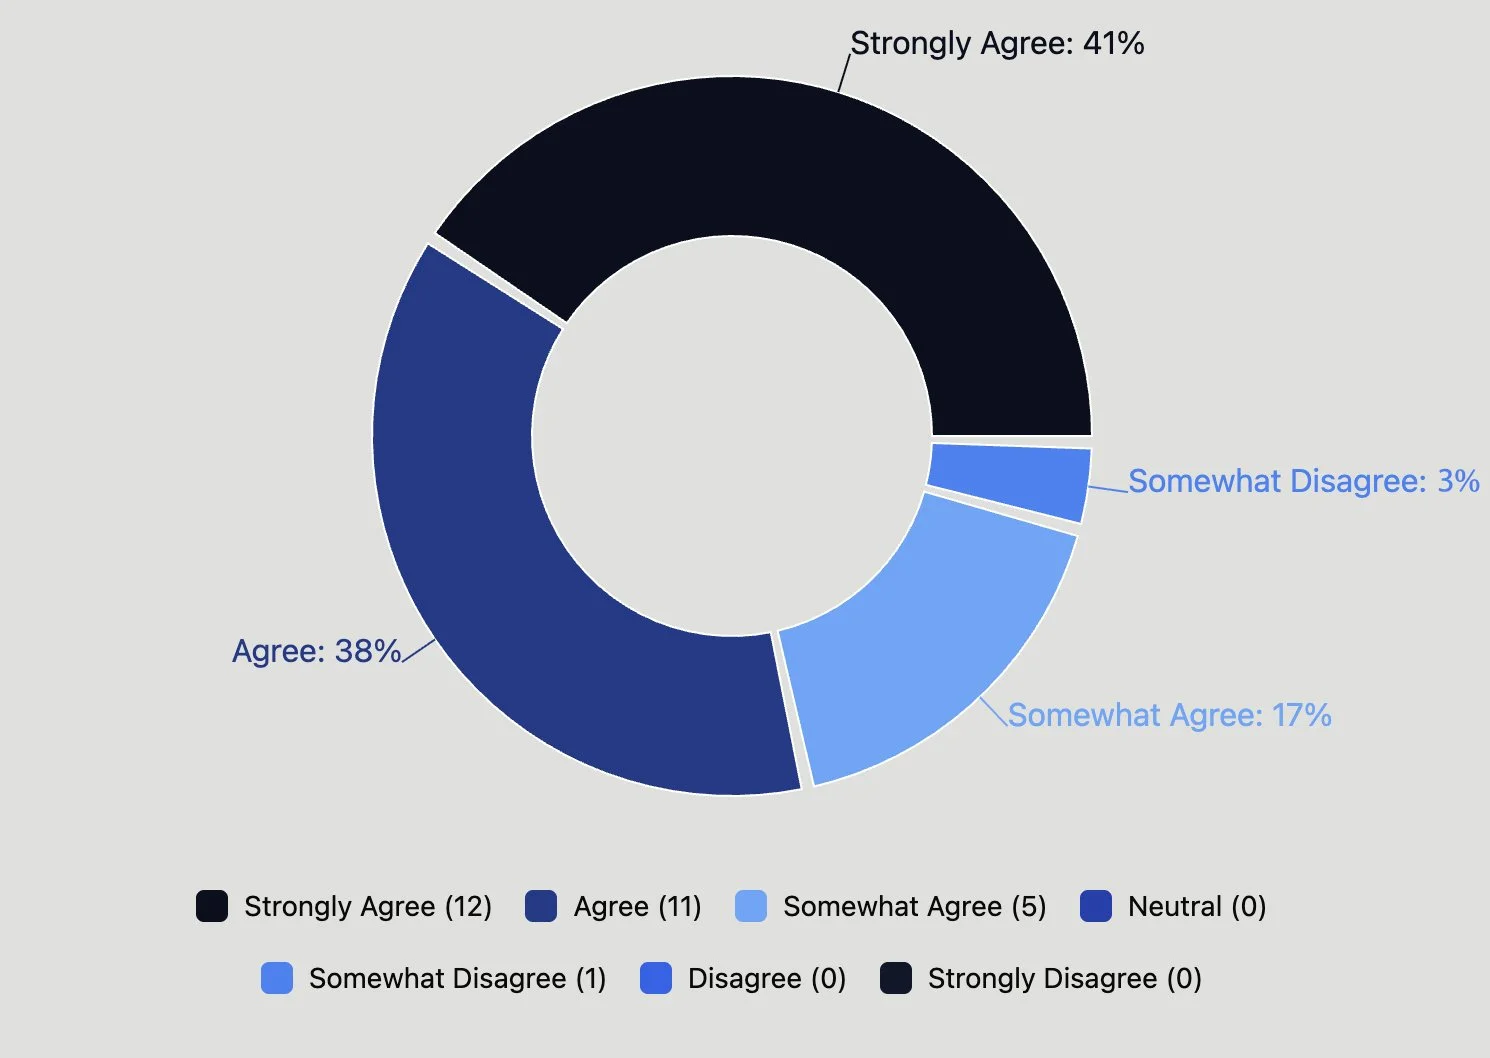
Diverse Perspectives & Inclusion
“My workplace is made up of people who have diverse experiences and perspectives.”
PH&S Average Weighted Response: 24
PH&S Risk Indicator: 10%
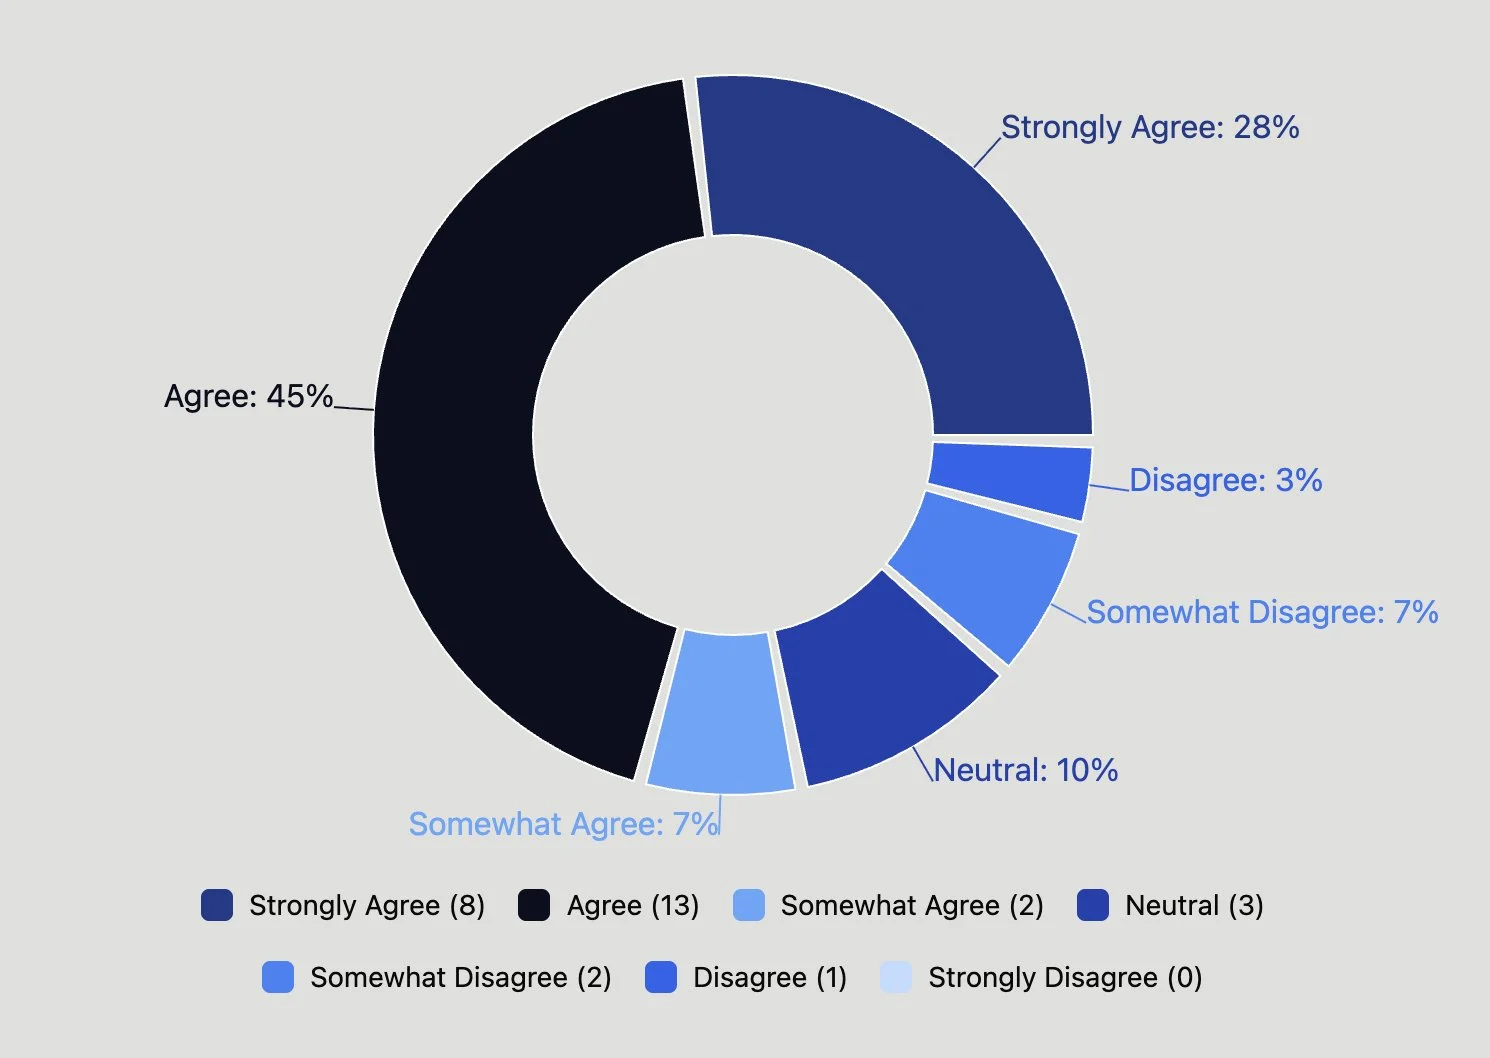
Clear Reporting Pathways & Behavioural Standards
“If I am being harassed, bullied or discriminated against at work, I know what to do and who to contact in my workplace.”
PH&S Average Weighted Response: 26
PH&S Risk Indicator: 14%
*Average Weighted Response reflects overall severity across the full response distribution. Risk Indicator reflects the percentage selecting Somewhat Disagree / Disagree / Strongly Disagree.
Why this matters
Strengths in Physical Safety & Proper Equipment, Diverse Experiences and Perspectives, and Clear Reporting Pathways for Harassment, Bullying, and Discrimination reflect important foundations that support clarity, inclusion, and prevention across the workplace. These conditions can help managers feel prepared and informed about how to respond when issues arise. At the same time, policies and processes are most effective when supported by trust and respectful leadership behaviours; employees may know what to do, yet still hesitate to act if interpersonal risk feels high. Sustaining these strengths — while continuing to strengthen trust, respect, and psychological safety — supports clearer communication, earlier problem identification, and a balanced approach to performance, governance, and risk mitigation.
Human Capacity Signals (Mental Health)
In addition to workplace conditions, it is important to understand how managers are currently experiencing human capacity.
The Mental Health Signals reflect how frequently managers have experienced specific conditions over the past two weeks. These indicators provide context for overall capacity within the cohort.
Note that Signal Levels reflect the overall weighted frequency of this experience, converted to a number out of 100 for easier interpretation. High Strain Levels show the proportion of people reporting this more than half the days or nearly every day, while Extreme Strain Levels highlight those experiencing it nearly every day — helping us understand both the overall pattern and how concentrated the strain may be within the group.
Highest Frequency Indicators (risks)
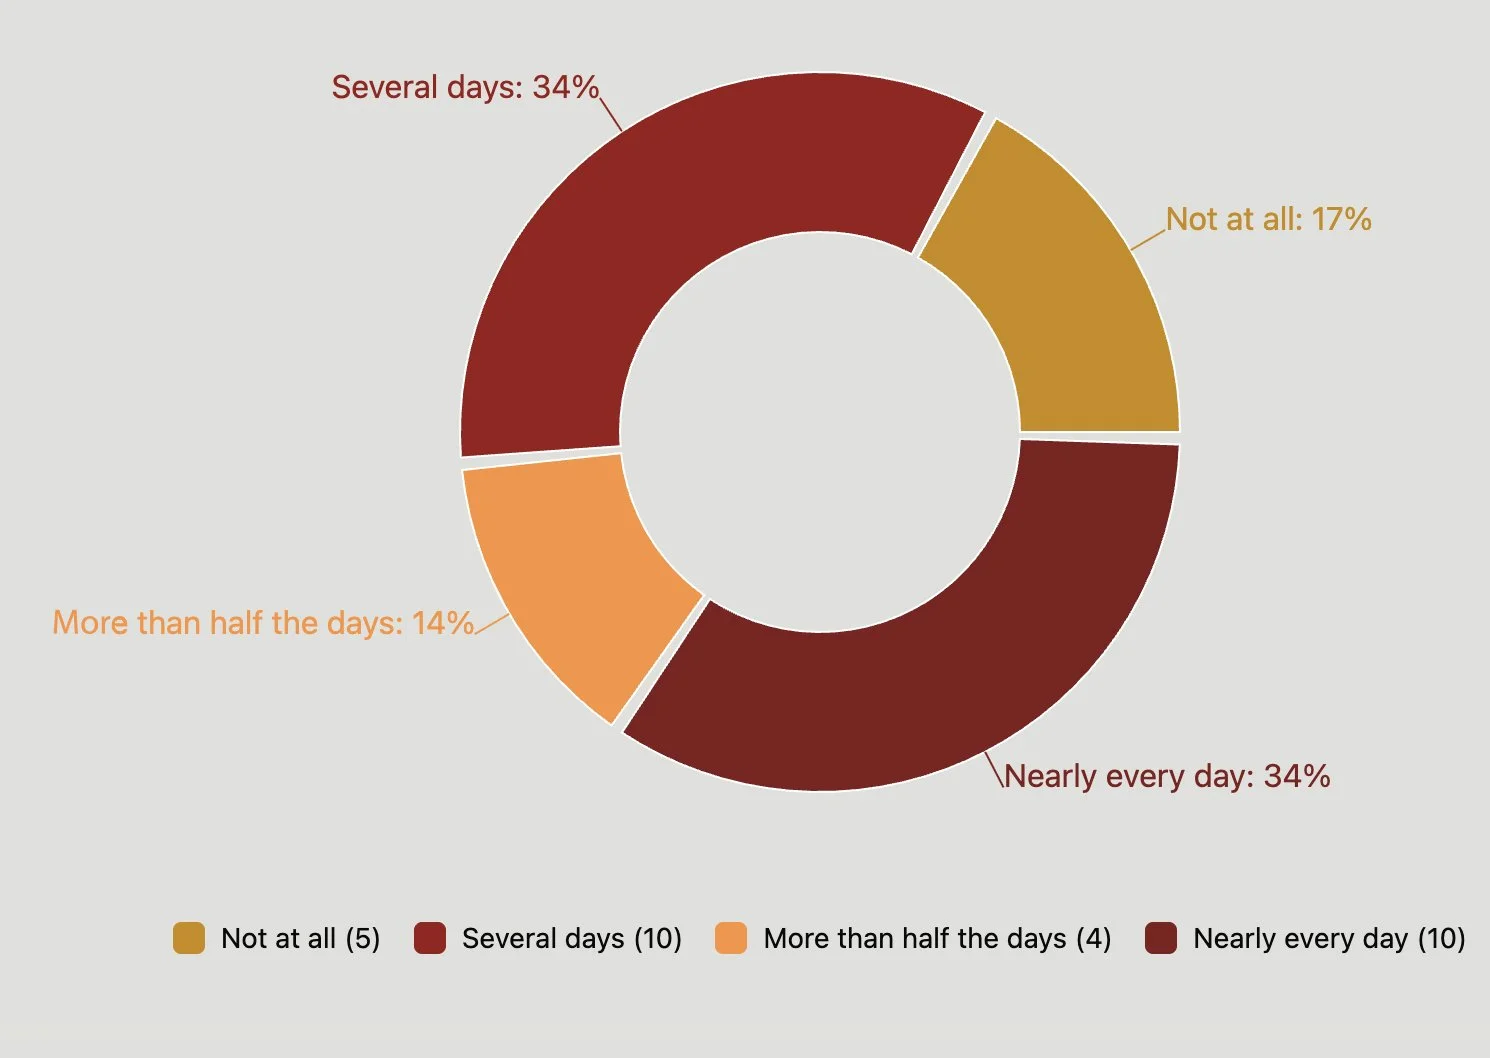
Stress
Signal Level: 59
High Strain Level: 52%
Extreme Strain Level: 38%
A significant portion of managers report experiencing stress more than half the days and nearly every day.
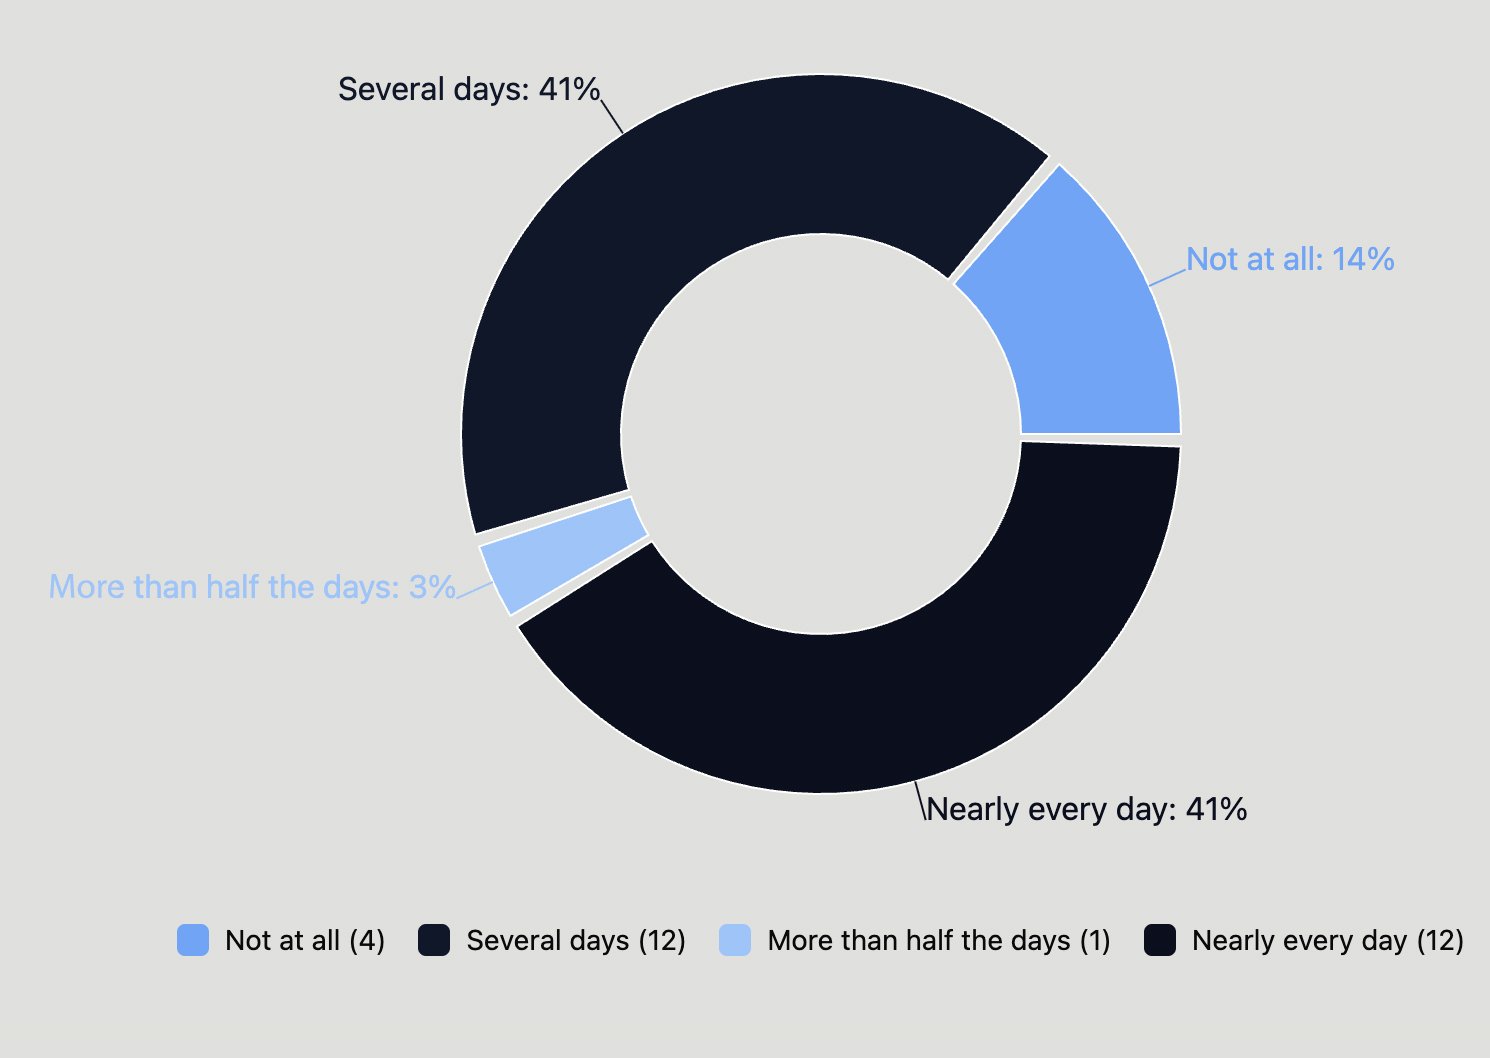
Burnout
Signal Level: 57
High Strain Level: 55%
Extreme Strain Level: 34%
Burnout levels are similarly elevated, with more than half of respondents reporting frequent strain.
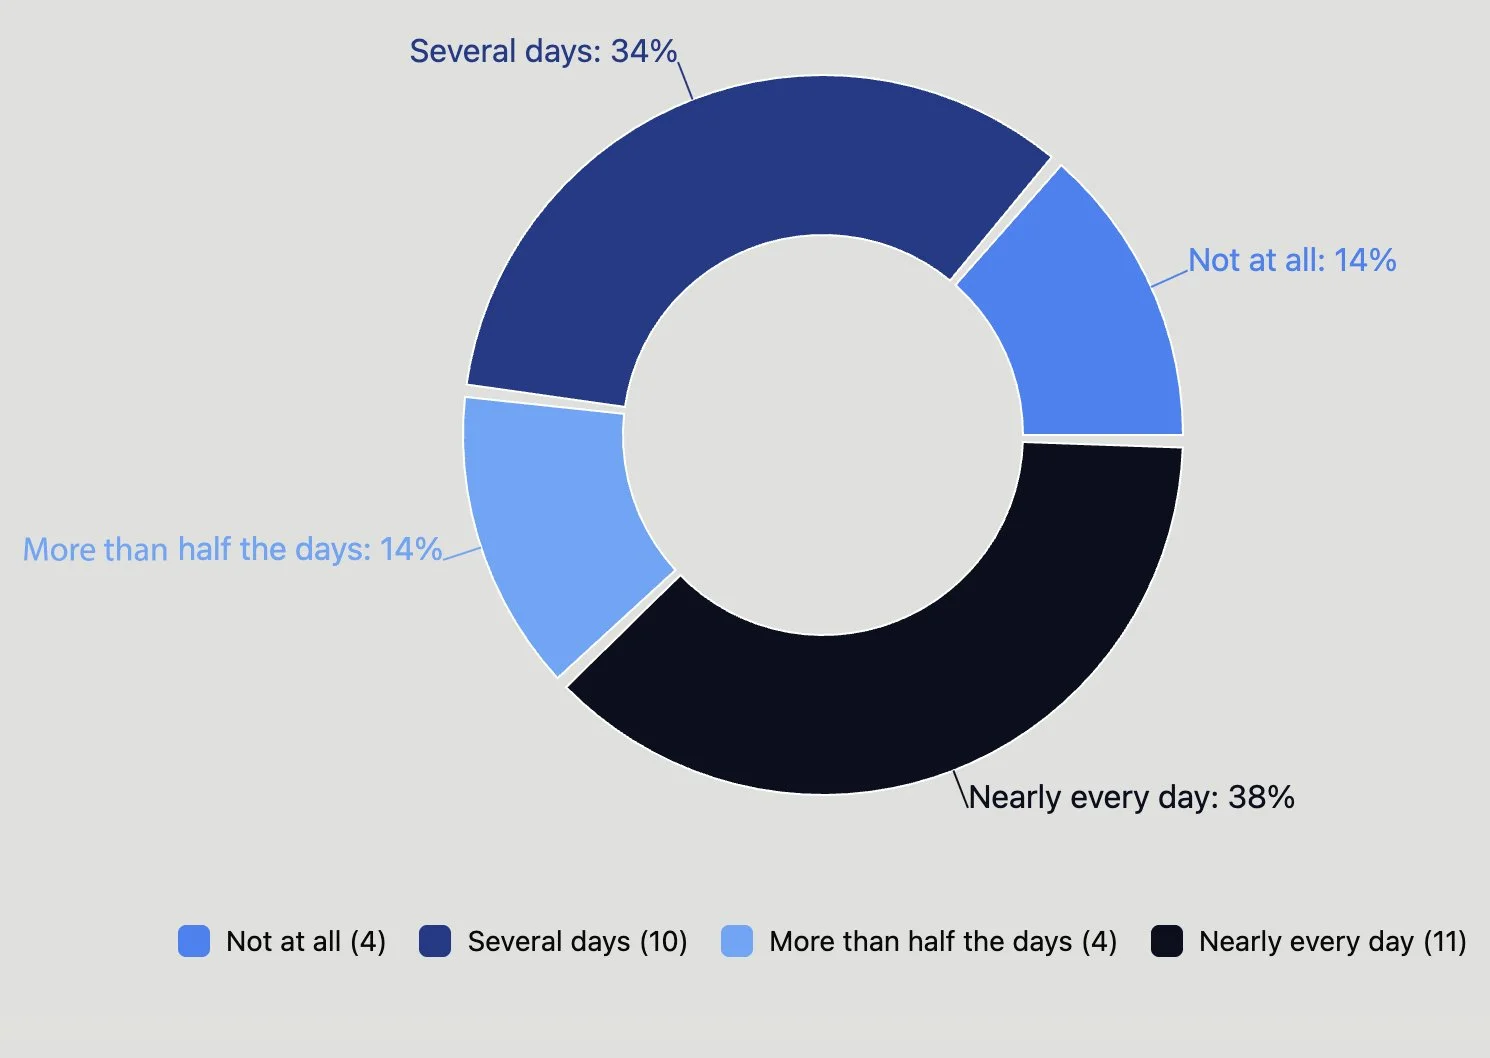
Worry
Signal Level: 57
High Strain Level: 45%
Extreme Strain Level: 41%
Worry registers consistently across both sustained and extreme strain indicators.
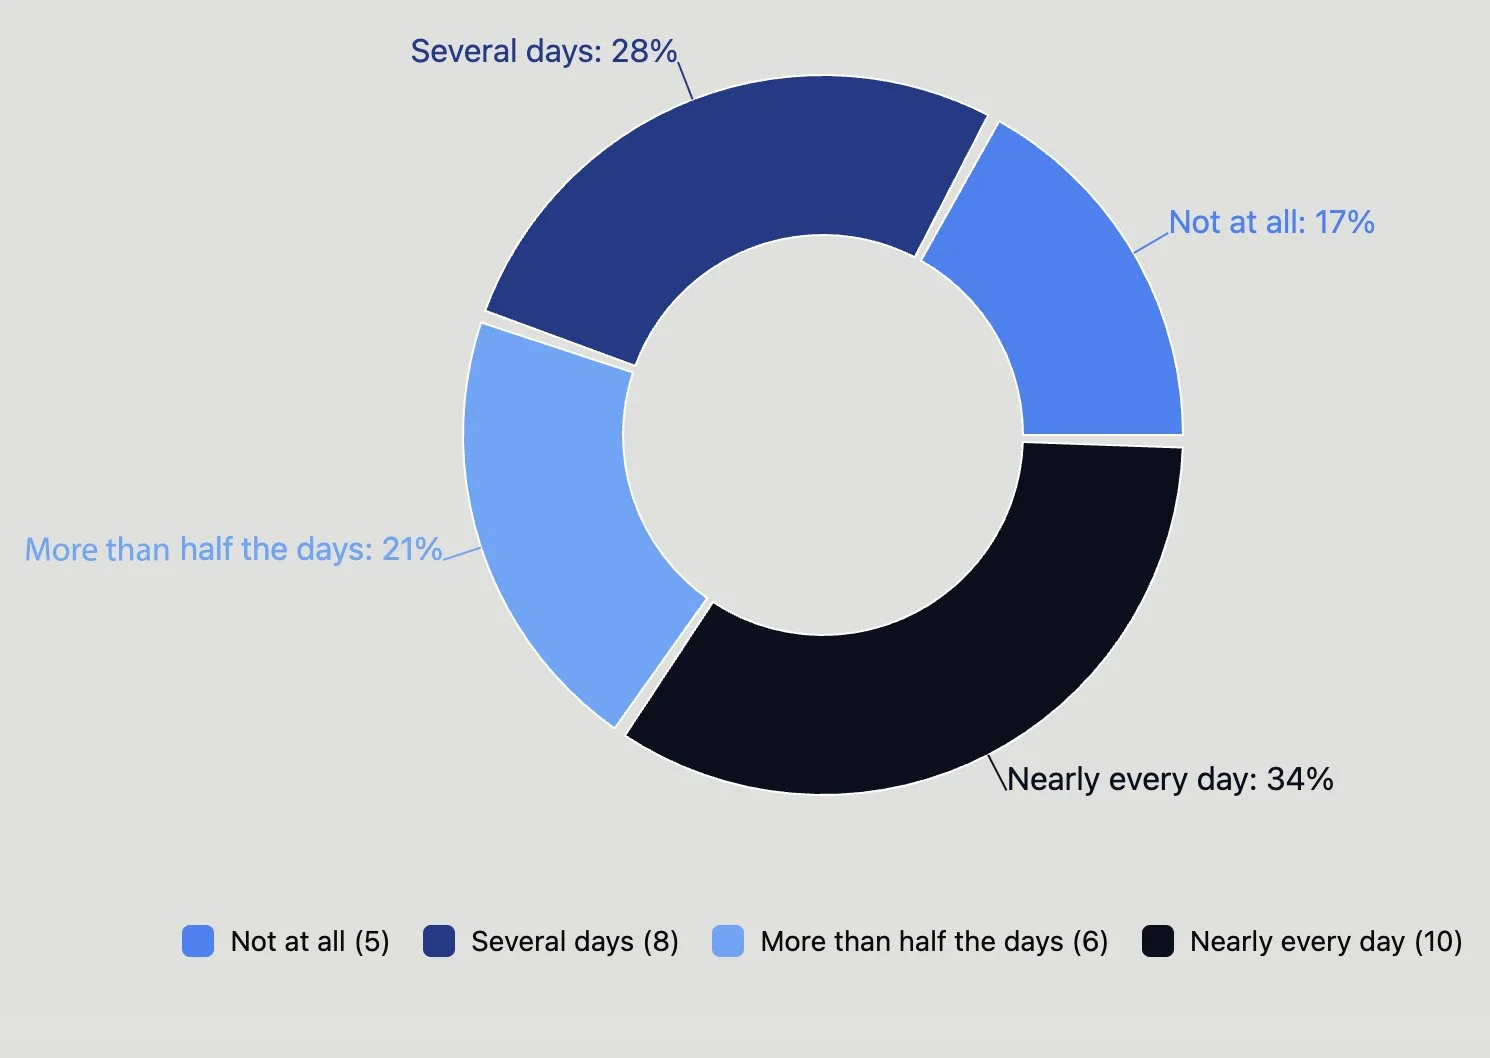
Anxiety
Signal Level: 55
High Strain Level: 48%
Extreme Strain Level: 34%
Anxiety follows a similar pattern of sustained frequency.
Why this Matters
Stress, Burnout, Worry, and Anxiety reflect the level of psychological load individuals may currently be carrying while doing their work. These experiences are shaped by a combination of workplace conditions and factors outside of work — including home responsibilities, financial pressures, and broader social or global concerns. While not all strain originates in the workplace, the work environment plays an important role in either supporting or easing that load through clarity, connection, and psychological safety. When capacity is under pressure, communication can become more cautious, collaboration may narrow, and the likelihood of mistakes, silence, or reduced productivity can increase. These findings provide high-level directional insight rather than root-cause conclusions; in the next phase of the framework, deeper exploration helps clarify the drivers behind these signals — including the extent to which stressors may be workplace-related and where targeted support may be most effective.
While the risk signals help us understand where pressure may be present, the data also highlights areas of strength within the cohort. These strengths do not suggest the absence of strain for everyone; rather, they indicate where human capacity appears more supported overall. Looking at both risk and strength together provides a more complete picture — helping us understand not only where support may be needed, but also what is already working well and can be reinforced moving forward.
Areas of Strength and Resilience
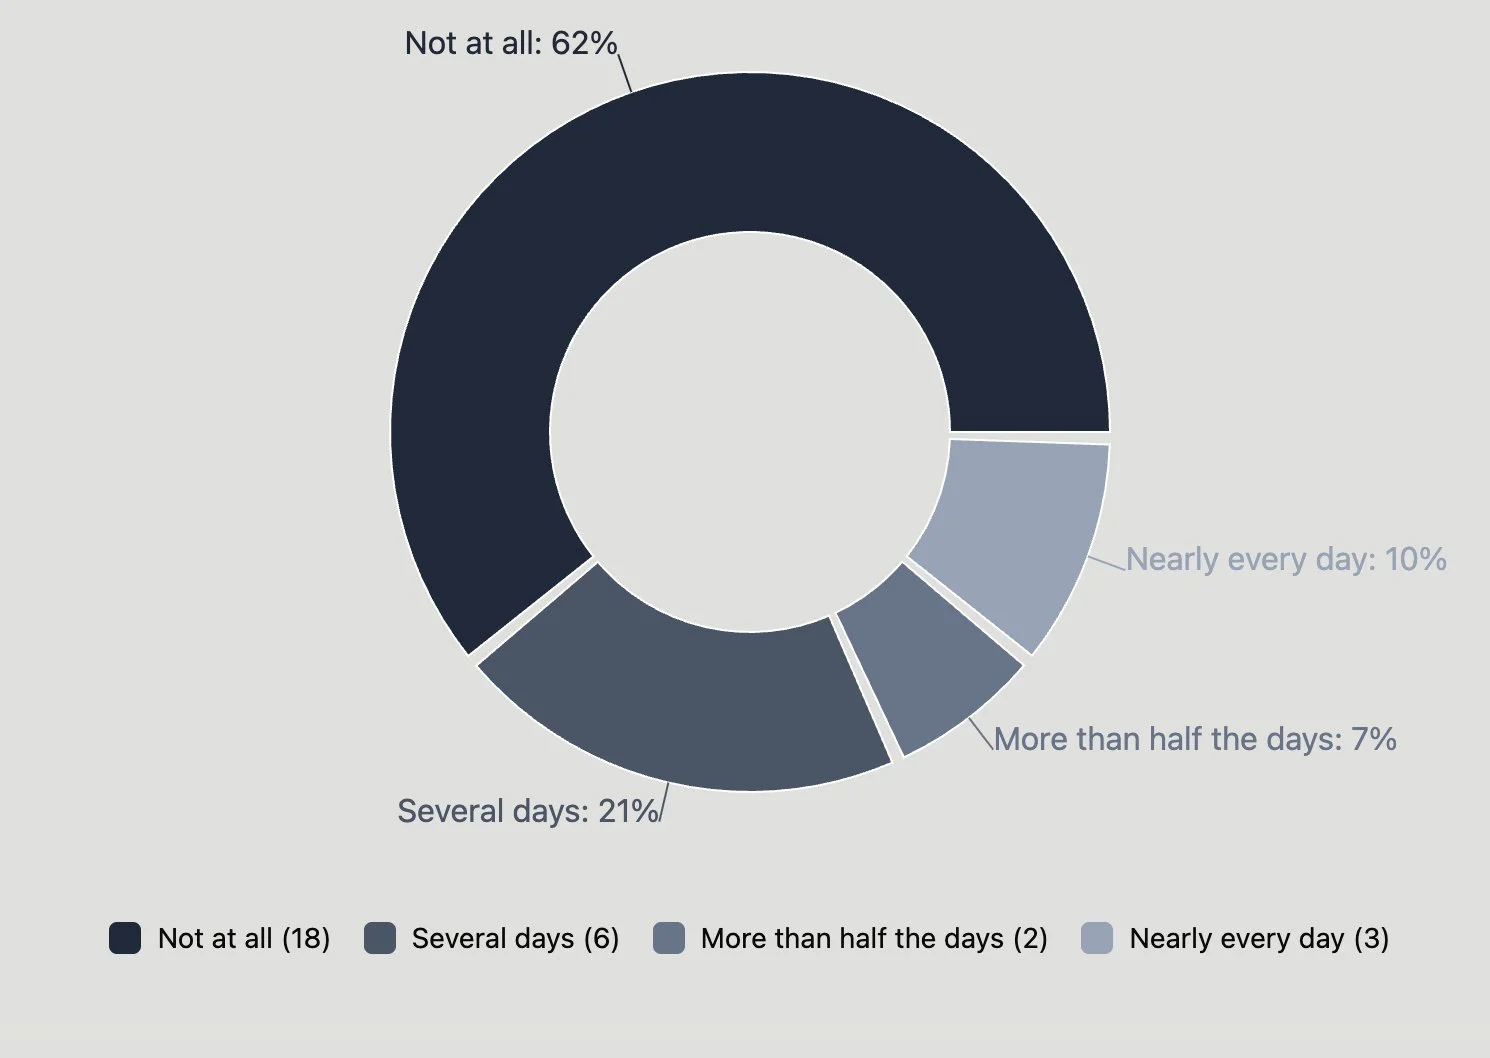
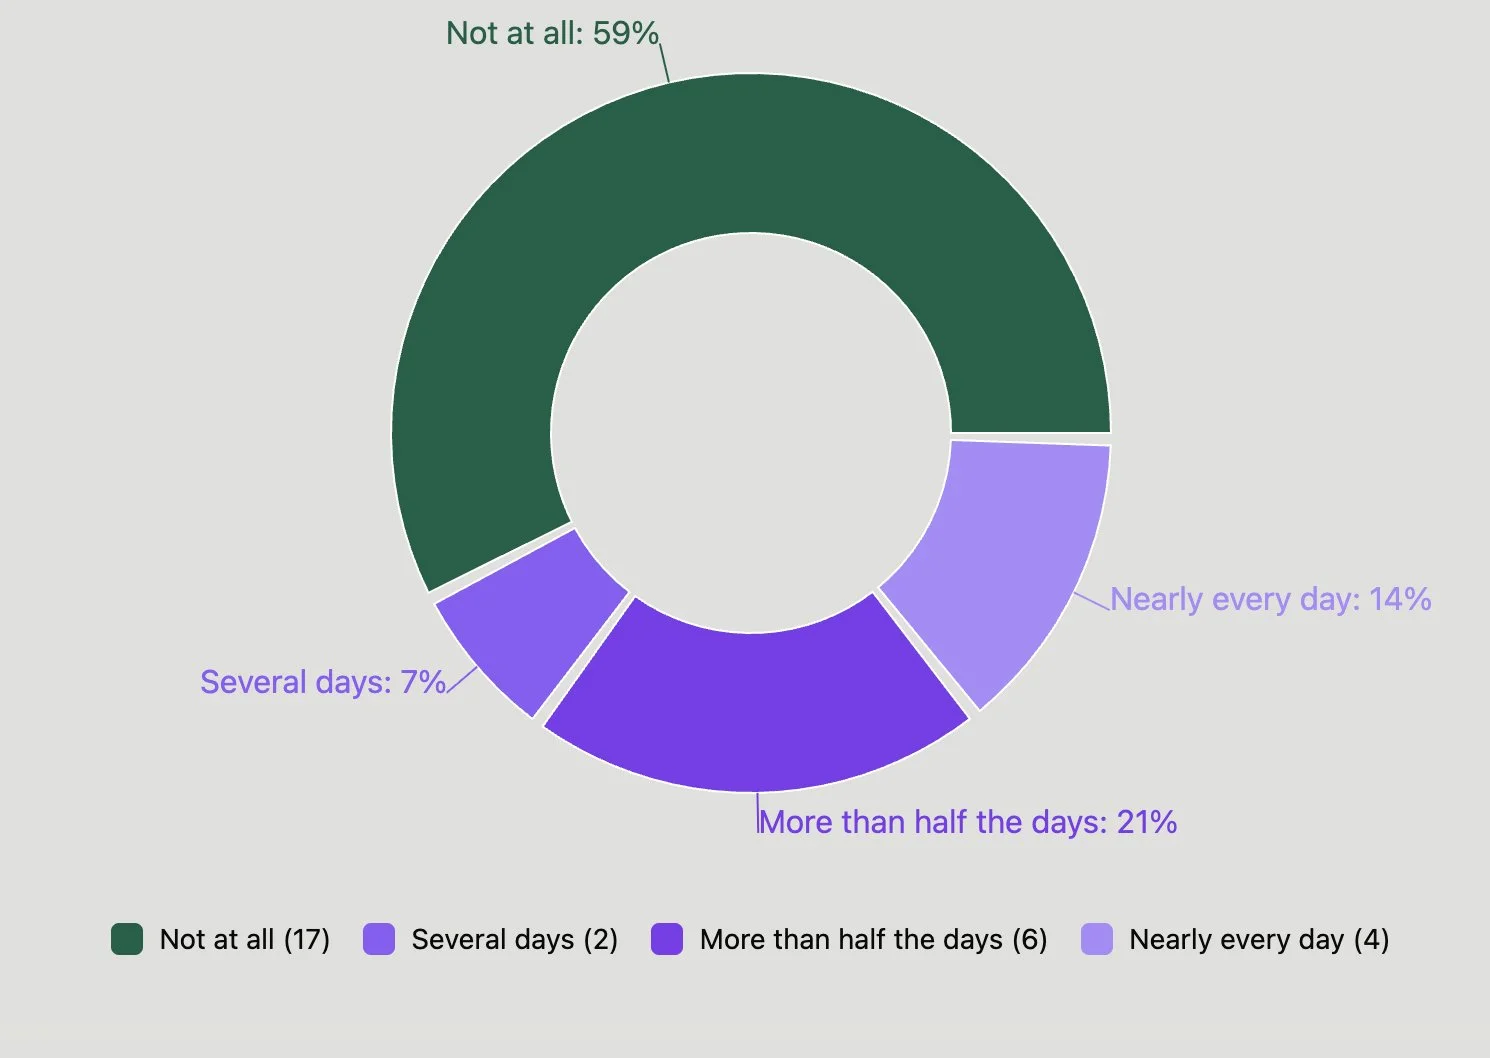
Depression
Signal Level: 22
High Strain Level: 17%
Extreme Strain Level: 10%
Depression trends lower compared to other conditions and may be considered a relative area of resilience within this dataset.
Loneliness & Isolation
Signal Level: 30
High Strain Level: 34%
Extreme Strain Level: 14%
Relative to other signals, loneliness registers lower overall frequency, though it remains present for a segment of the cohort.
Why it Matters
Lower signals of loneliness, isolation, and depression suggest that many managers may be experiencing stronger connection, steadier mood, and more consistent emotional capacity in their roles. From a psychological health and safety perspective, this matters because social connection and emotional stability support clearer communication, collaboration, and shared problem-solving - particularly in environments where staff may work independently across facilities. When people feel more connected and supported, they are generally more likely to reach out, ask for input, and engage constructively with colleagues, which strengthens team cohesion and helps information flow more freely across sites.
At the same time, these strengths are influenced not only by workplace conditions but also by personal support networks and life circumstances. External factors, such as family responsibilities, community connection, or social supports, can either buffer or amplify workplace pressures. Recognizing this helps leaders understand that maintaining connection at work is not just a social benefit; it contributes to steadier collaboration, reduces the likelihood of withdrawal or silent coping, and supports sustainable productivity across distributed teams.
Interpreting the System Together
Looking at environmental conditions (PH&S) and mental health signals together provides a clearer view of how the system is functioning. When elevated PH&S risk exposure and elevated mental health strain are present at the same time, it can suggest areas where organizational conditions may be contributing to sustained pressure. From a governance and compliance perspective, structured measurement supports evolving duty-of-care expectations and helps leadership monitor both risk and capacity over time.
Psychological health and safety and mental health are shared and interconnected, but they are not the same. Individuals influence their own wellbeing, while the organization shapes the conditions in which that wellbeing is experienced at work. When workplace systems, relationships, and operational realities align well, unnecessary pressure is reduced which can help create an environment where people are better positioned to manage stress, worry, or anxiety, even when some factors remain outside organizational control.
To view results across all 17 PH&S areas and Mental Health responses, the complete data set is presented in table form in the following section. This allows leadership to see the relative weight of each condition and make informed decisions about where to focus attention next.
The following section introduces the organizational baseline metrics used to track movement over time, along with the contribution each risk factor makes to overall organizational risk.
Direction Forward
At this point, the question becomes practical: where will attention make the greatest difference?
Not all areas of exposure influence the system equally. Some conditions carry more structural weight than others. To understand that concentration, we examine contribution.
(Contribution chart appears here) Dio Note that this is the “Organizational Impact (%) column from our excel spreadsheet. I had always envisioned a pyramid with 17 bars or something….
Chart should include:
All Q1–17 PH&S statements
Each statement’s Organizational Impact (%)
Top three highlighted
Callout: “Top three drivers account for approximately 24% of total PH&S exposure.”
The same three conditions that registered the highest severity and the highest breadth of disagreement also account for the largest share of overall exposure:
Job Security / Stability
Trust in Leadership
Respect by Leadership
This alignment across multiple lenses strengthens confidence in the signal. We are not relying on a single metric. The pattern is consistent across:
PH&S Average Weighted Response
PH&S Risk Indicator (breadth of disagreement)
Organizational Impact (contribution to overall exposure)
From a leadership standpoint, that clarity matters.
If effort is going to be applied, these areas are most likely to produce meaningful system movement. They influence how managers interpret change, how secure they feel in their roles, and how consistently their contributions are acknowledged.
Alongside this, sustained strain in stress and burnout suggests that capacity pressure is not isolated. When environmental exposure and human strain sit together, the risk to operational stability increases over time.
The opportunity is precision. Focus attention where leverage is highest. Introduce measured, role-specific adjustments that reduce exposure without disrupting operations.
This is not about sweeping change. It is about targeted movement — and measuring progress as it occurs.
Some options for direction:
While Job security is the loudest signal, but trust is the condition that determines whether anything we say or do about it will land.
Next Steps
Opening this conversation and asking managers directly about psychological health and safety and mental health is a meaningful leadership decision. The participation rate and the strength of Measurement Readiness suggest that this step was taken seriously. Managers engaged. They responded. They indicated that this work matters.
That is a solid starting point.
At the same time, the Rapid Assessment is intentionally only one part of a larger framework. It provides clarity and direction, but it is not designed to solve the issue on its own.
The next step is to select one area that makes sense for this organization to focus on next, informed by the data in this report and also informed by what leadership already knows through formal and informal insight. The data narrows the field. Your experience provides context. We want to work on one area at a time.
From there, Phase Two allows us to take a closer look at that specific condition through a Spotlight. That deeper look helps clarify what is driving the exposure and where practical adjustments can be made. The Playbook phase then supports implementation, providing role-specific actions that are manageable and measurable.
There is no commitment required at this stage. The choice of whether to move forward, and where to focus, remains with leadership.
There is, however, one step that should not wait.
Before any deeper work begins, it is critical to close the loop with the managers who participated. We recommend initiating a Trust Reinforcement Communication. This is a short, timely message that acknowledges participation, reinforces confidentiality, summarizes high-level themes, and signals that leadership is reviewing the findings carefully.
The TRC is not about having all the answers. It is about demonstrating that participation leads to response. This communication will contribute to increasing trust and respect - two areas that will have the largest return on investment.
We also encourage thoughtful consideration of how much of these findings should be shared more broadly. Appropriate transparency strengthens credibility. It reinforces respect. It begins improving some of the very areas this assessment highlighted — particularly around trust and communication.
This report provides clarity. The engagement is present. The next step is focused, deliberate movement — beginning with acknowledgment, and followed by selecting one area where leadership can make a meaningful difference.
Appendix
Add table with all the results from all 24 questions
Also any references and links to National Standard etc.