
Rapid Assessment Dashboard - Client Reference 769437
Current Program: Q2 RAPID ASSESSMENT
Client ID: 769437
Survey: Rapid Assessment RA 032526
Population - P01
Run - R01
Date of run: April 2nd - April 14th, 2026
Executive Summary
The goal of this Rapid Assessment is to measure Psychological Health & Safety and Employee Mental Health, and to identify organizational risk and opportunity in relation to compliance, business productivity, and employee wellness. It clarifies where the system is strong, where it is strained, and where leadership focus will have the greatest impact. This first phase provides directional clarity and establishes a baseline from which informed decisions and measurable progress can follow.
We measured Psychological Health & Safety (PH&S) across 17 workplace conditions and Employee Mental Health Signals across four conditions. We also measured Measurement Readiness - the degree to which managers support ongoing reflection and engagement in this work. 92% percent of managers participated, and the Measurement Readiness Score (MRS) of (88 reflects strong endorsement) from managers to continue engaging in Psychological Health & Safety and Mental Health initiatives.
The results of the Rapid Assessment identified:
Top Three PH&S Risk Areas:
Job Security & Stability
Trust in Leadership
Respect by Leadership
Top Three PH&S Strength Areas:
Diverse and Inclusive Perspectives
Physical Safety and Proper Equipment
Clear Reporting Pathways for Harassment, Bullying, and Discrimination
Top Three Mental Health Risk Areas:
Elevated Worry
Elevated Stress
Elevated Burnout
Top Mental Health Strength Areas:
Lower Loneliness & Isolation Signals
Lower Depression Signals
These findings can carry operational and governance implications, particularly where elevated workplace exposure and elevated mental health strain appear together.
This first phase of the framework provides clarity and direction. From here, leadership determines how to respond. Future phases of the framework support that decision with structure, focus, and the ability to measure progress over time.
Brief Introduction
The data in this report connects workplace conditions (Psychological Health & Safety) with human capacity (Mental Health).
This is not about labeling the organization or leadership as strong or weak. It is about identifying areas where small, deliberate adjustments can create measurable improvement.
Before reviewing the results, it’s helpful to know what this assessment actually measures.
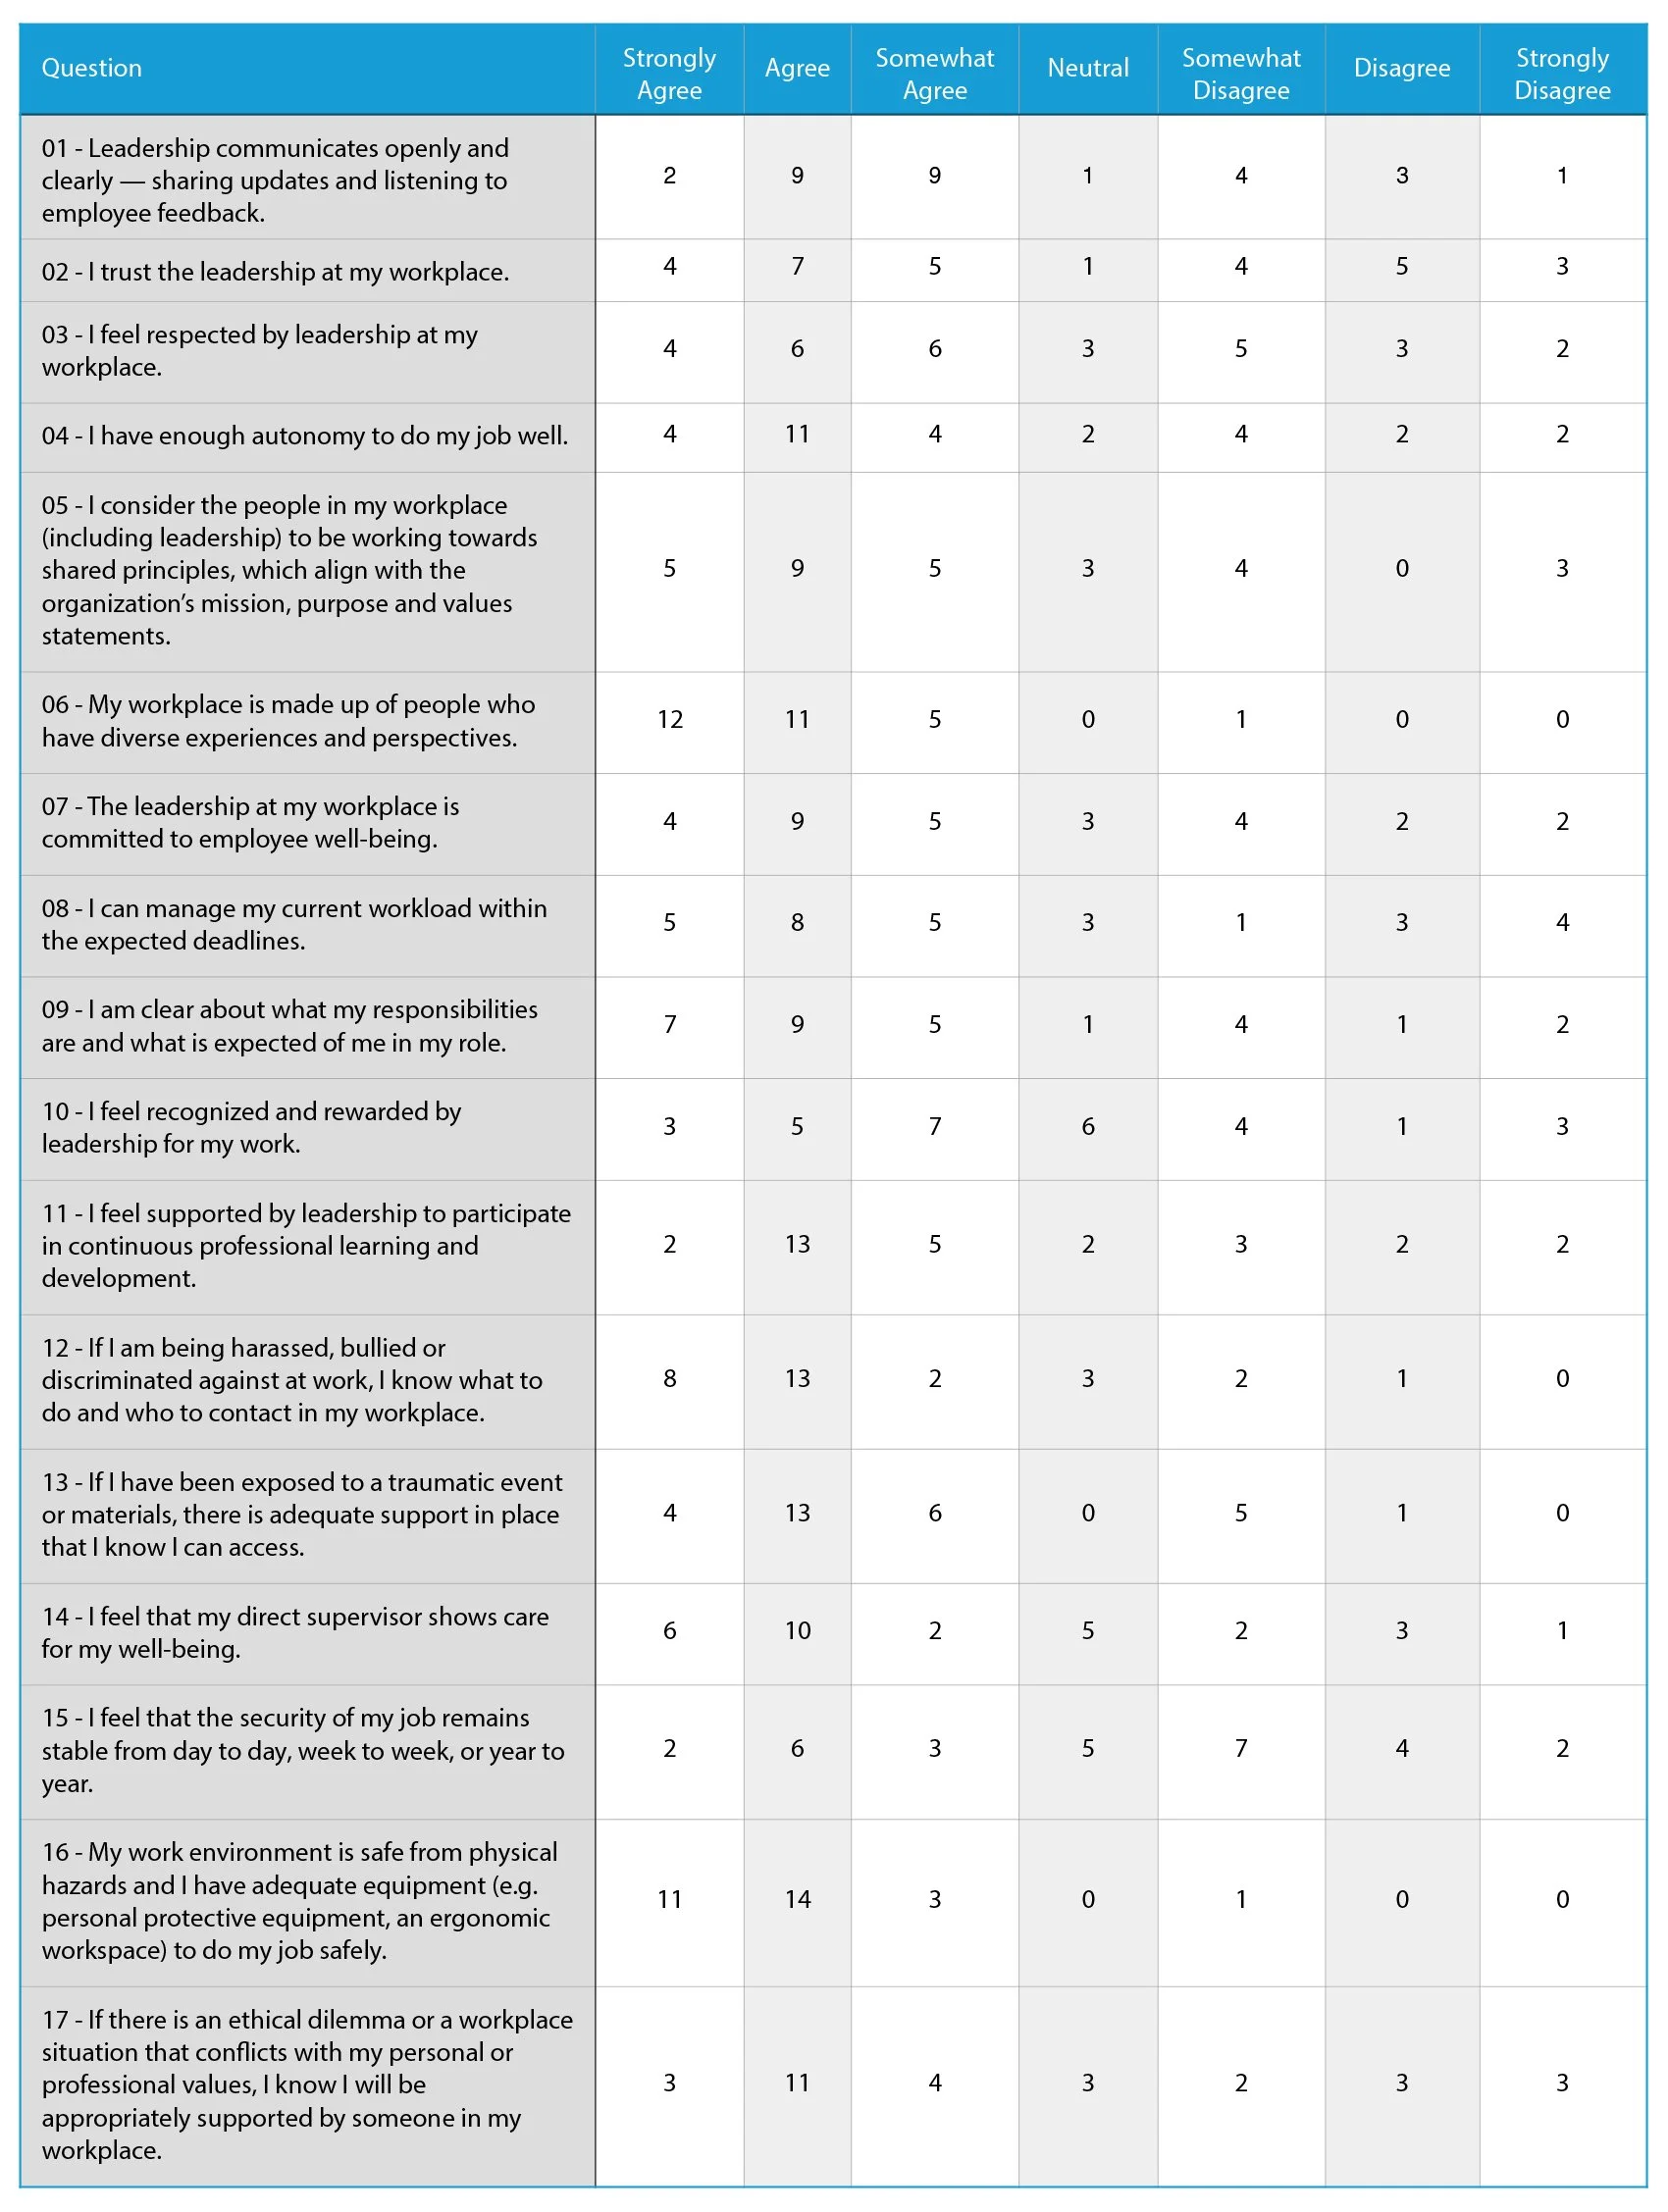
Questions 1–17 examine psychological health & safety conditions across Q2’s 14 Core PH&S Components. These components align with internationally recognized guidance (including ISO 45003), the Canadian National Standard for Psychological Health and Safety in the Workplace, and regional expectations reflected in WorkSafe BC’s direction on psychological injury prevention. Together, they assess, among other things, leadership behaviours, communication patterns, workload structures, role clarity, interpersonal safety, and reporting systems that shape day-to-day work experience.
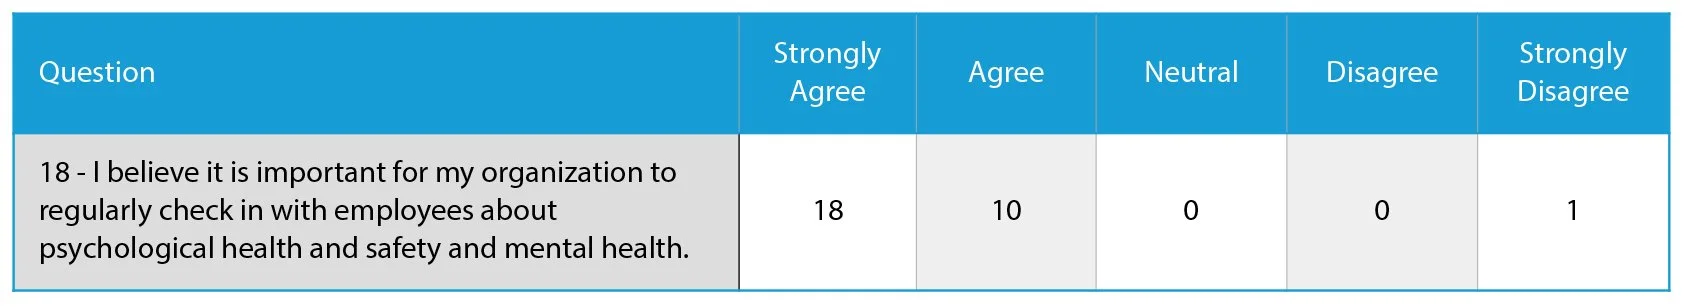
Question 18 serves a different purpose. It measures readiness for ongoing measurement and dialogue — indicating managers’ readiness to continue structured measurement and improvement. This reflects governance, transparency, and openness to this work.
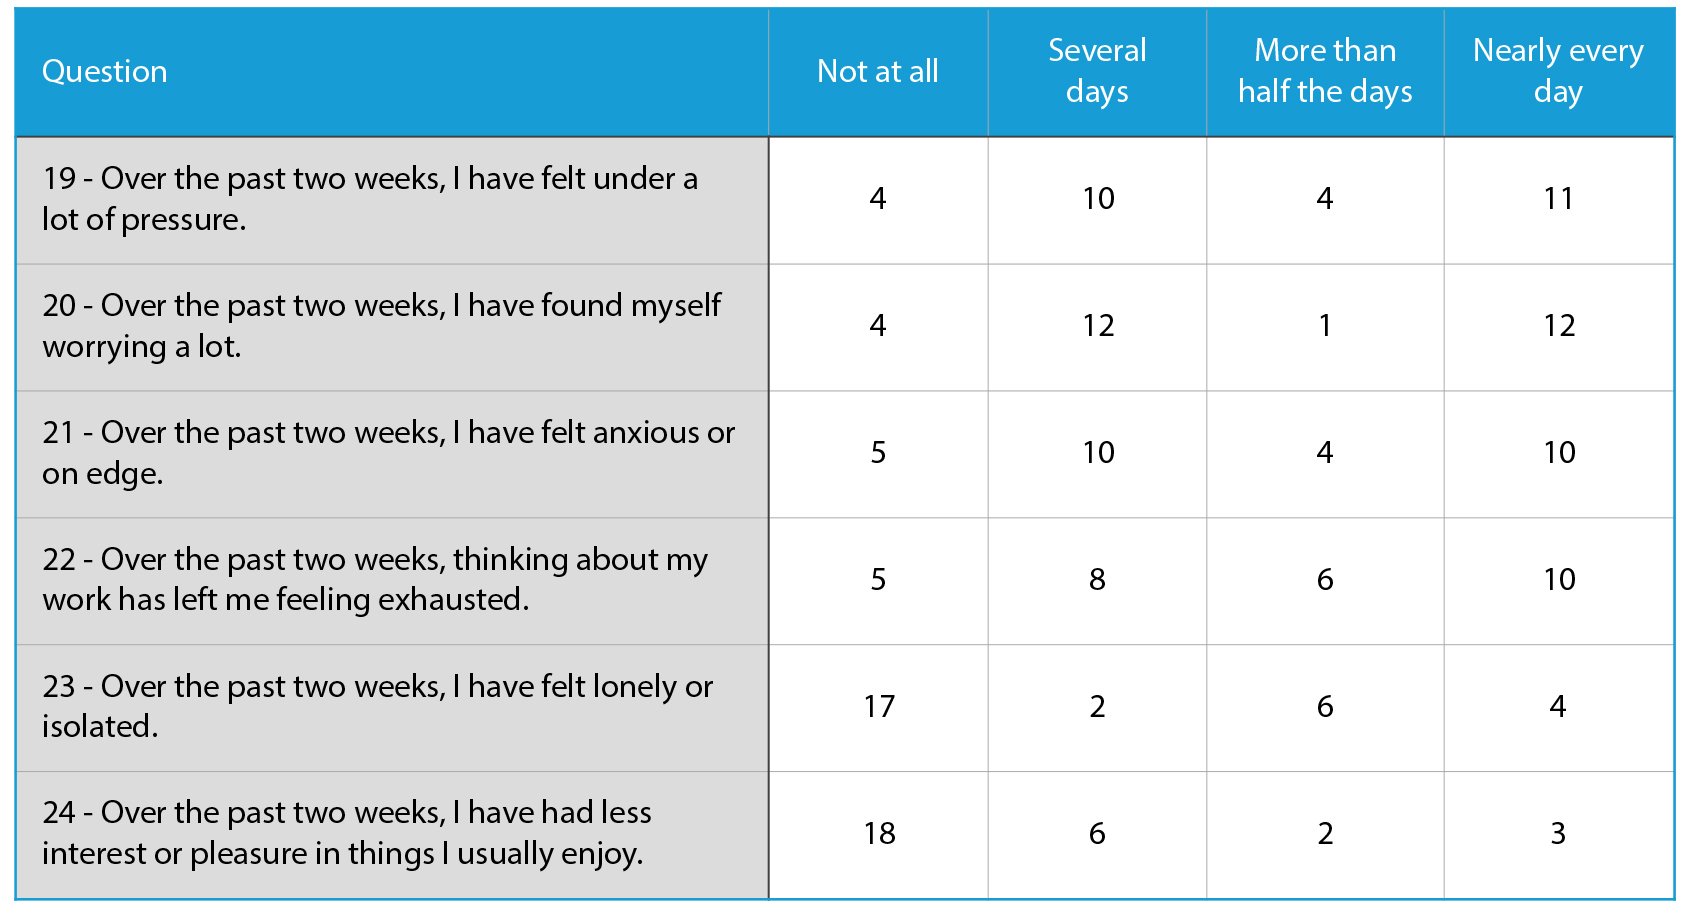
Questions 19–24 examine Employee Mental Health Signals — including stress, burnout, anxiety, worry, loneliness & isolation, and depression. These questions follow the structure of validated mental health screening tools but are used here at a high level and are not diagnostic. They provide insight into how managers are currently feeling and, when viewed alongside Psychological Health & Safety conditions, help leadership understand overall workforce capacity and potential impact on performance and risk.
Together, environmental conditions and human capacity shape how safely people communicate, how work gets done, and how risks are surfaced, managed, and learned from.
The numbers you will see are baseline indicators. They indicate direction, not diagnosis. They show where agreement is strong, where disagreement is present, and where pressure is concentrated.
In future phases of the framework we engage in deeper examination of drivers and targeted intervention.
Participation Engagement
We received responses from 29 of 48 managers (60%), which included Directors, Program Managers, and Functional Leaders (We will use the term “Managers” and “Management Cohort” when referencing the population of managers who completed the survey).
This level of participation is strong and meaningful, particularly in light of the data suggesting that some managers may perceive speaking up as carrying risk.
Question 18, our measure of readiness for ongoing measurement and dialogue, registered at 88, which is a strong endorsement. In plain terms, managers believe it is important to continue measuring and discussing psychological health and safety and mental health.
That’s encouraging and suggests this group is prepared to engage in and support change.
What follows is a detailed review of your organization’s top risk exposures and relative strengths across these domains.
Results - Key Areas of Exposure and Stability
The following section examines the three most elevated areas of exposure and the three strongest areas of stability across both PH&S conditions and Mental Health Signals. It also considers the implications of these findings for business productivity, employee wellness, and risk mitigation.
We begin with the areas of highest exposure within Psychological Health & Safety.
Psychological Health & Safety - Top Three Areas of Exposure
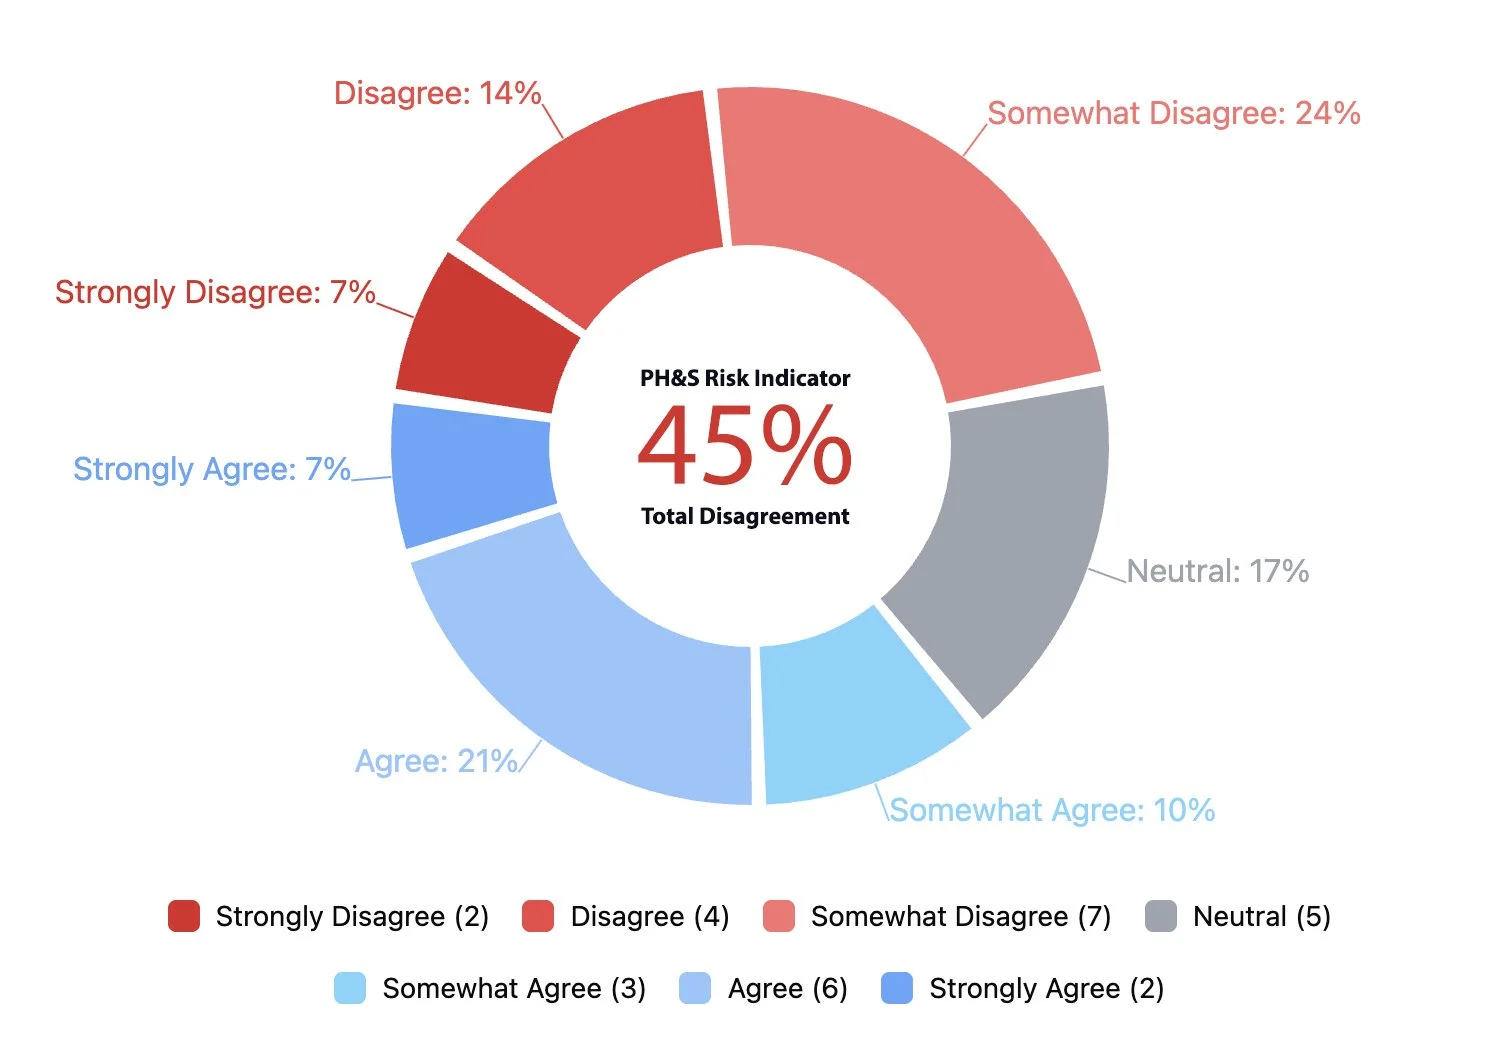
Job Security & Stability
“I feel that the security of my job remains stable from day to day, week to week, or year to year” (Q15)
Average Weighted Response: 50 Risk Indicator: 45%
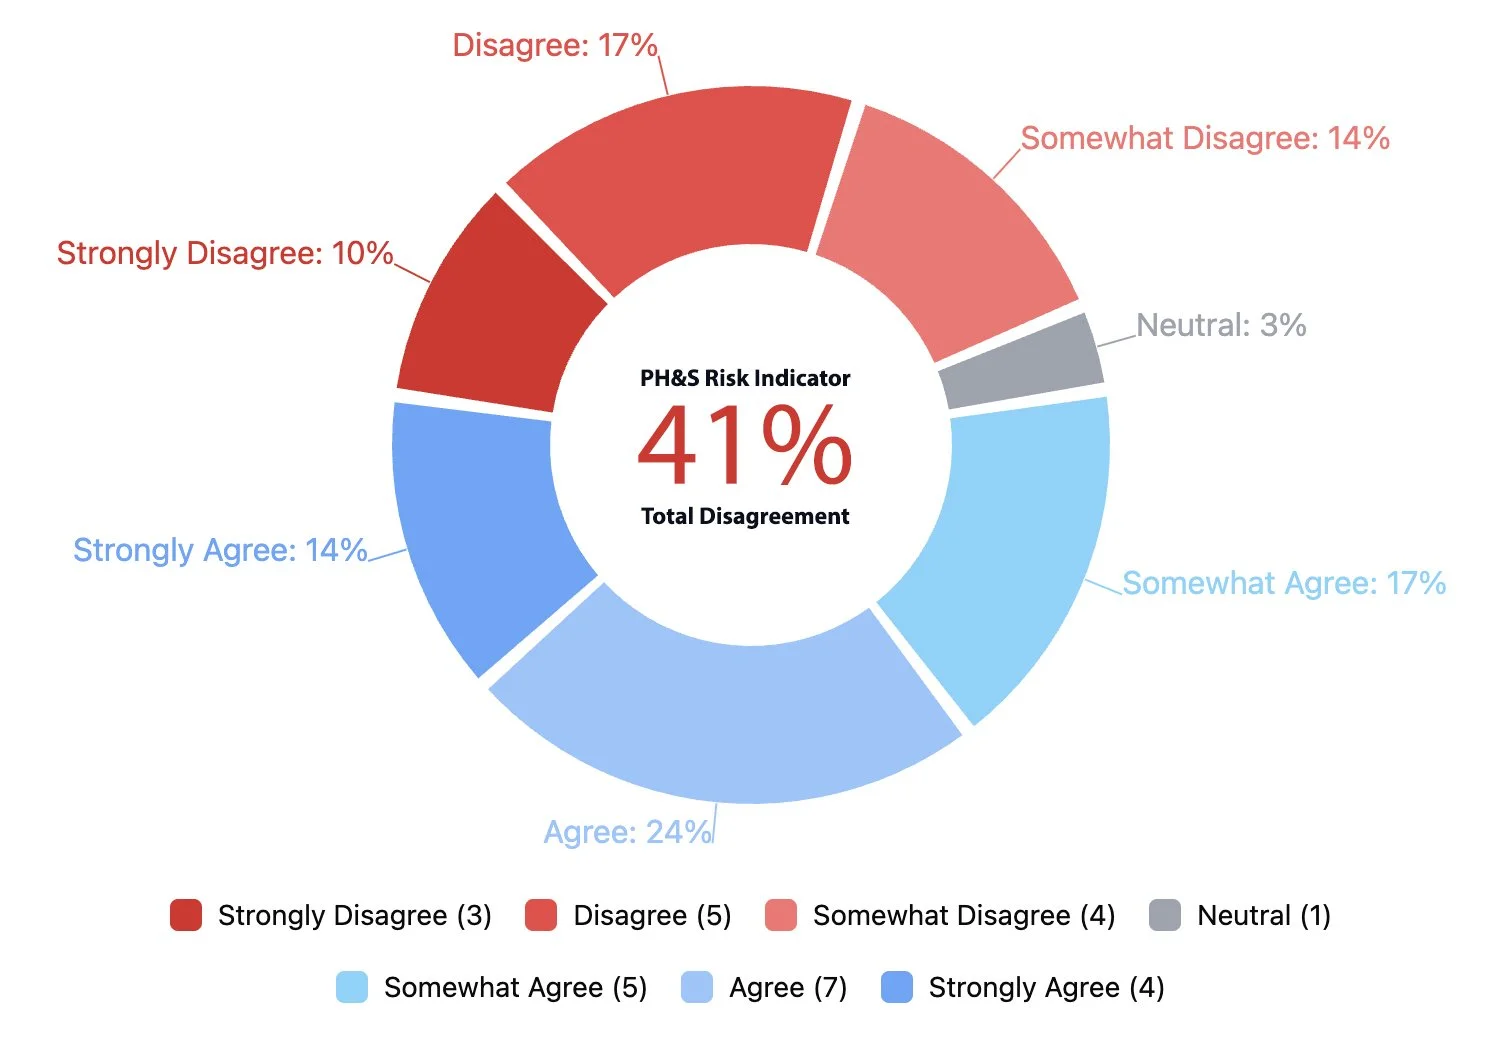
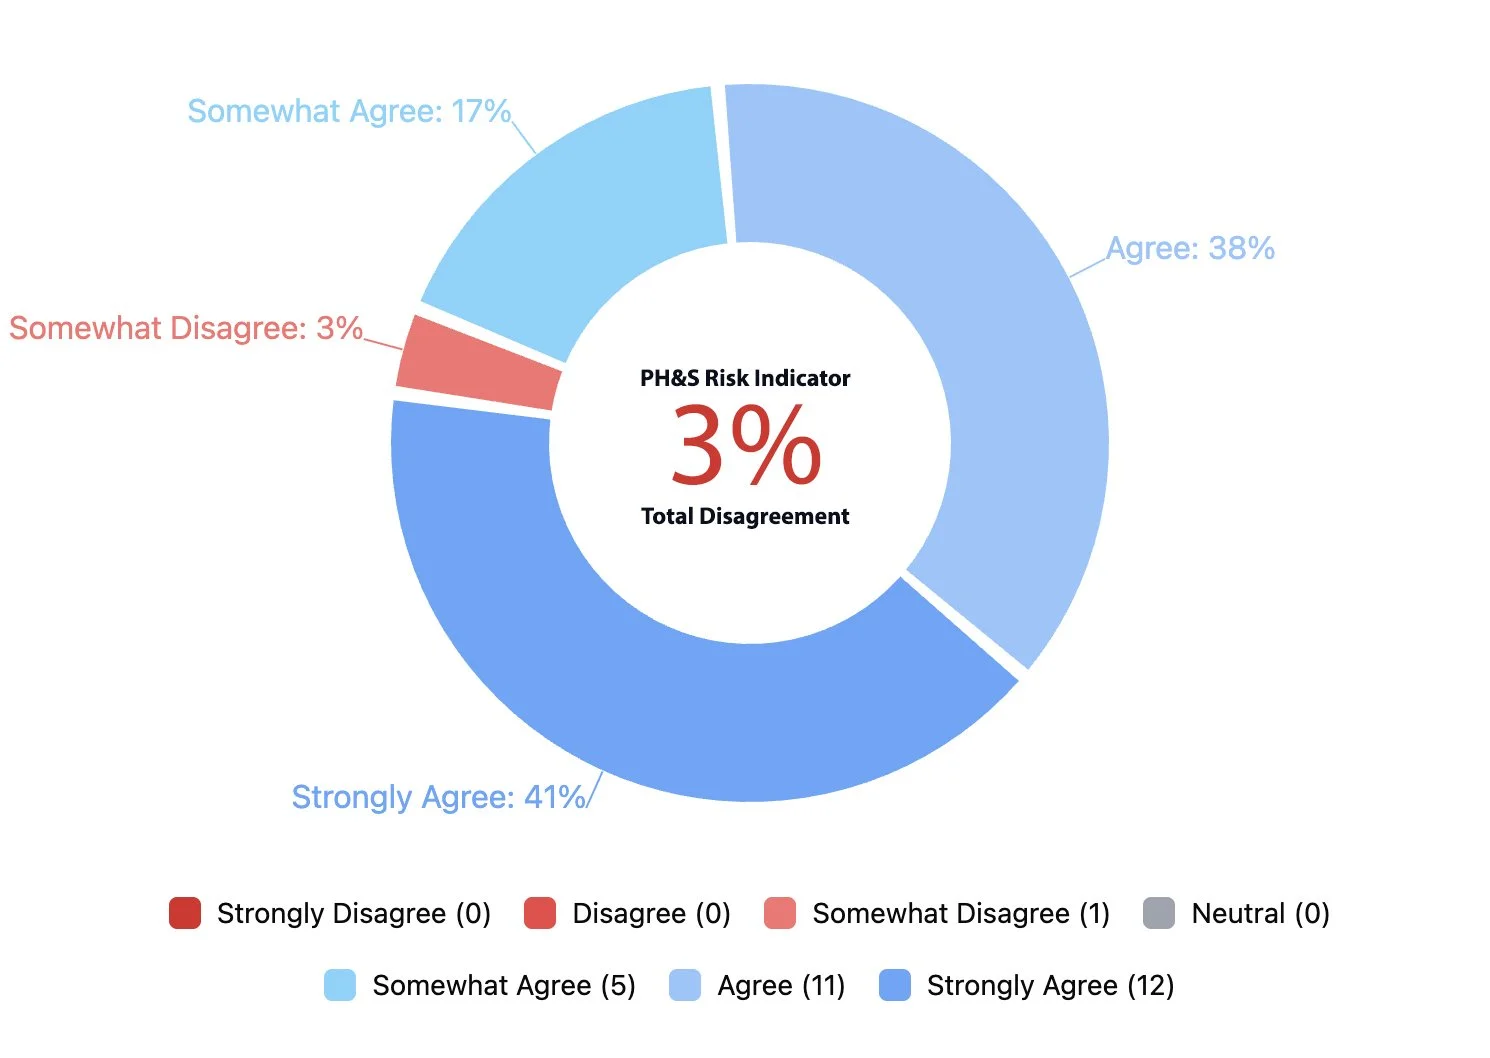
Trust in Leadership
“I trust the leadership at my workplace” (Q2)
Average Weighted Response: 45 Risk Indicator: 41%
Respect by Leadership
“I feel respected by leadership at my workplace” (Q3)
Average Weighted Response: 43 Risk Indicator: 34%
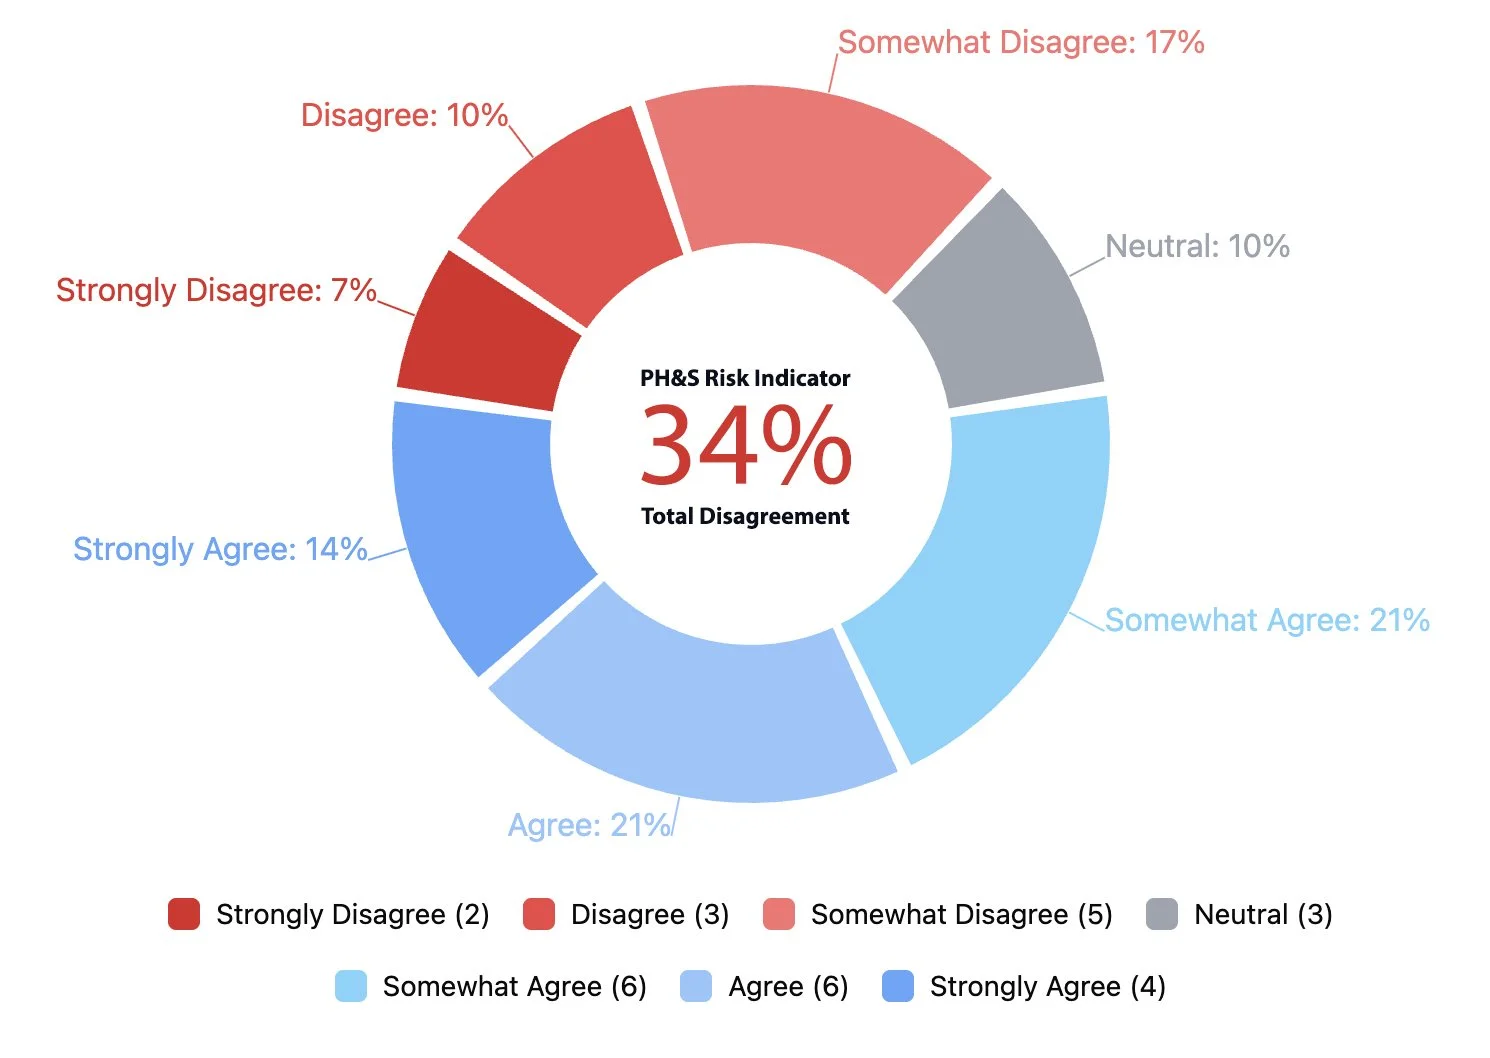
*Average Weighted Response reflects overall severity across the full response distribution. PH&S Risk Indicator reflects the percentage selecting Somewhat Disagree / Disagree / Strongly Disagree.
Why This Matters
Job Security & Stability, Trust in Leadership, and Respect by Leadership influence how safe managers feel communicating openly, raising concerns, and collaborating across the organization. These conditions are reflected in Q2’s Core Components and align with recognized guidance under the Canadian National Standard, ISO 45003, and WorkSafe BC’s direction on psychological health and safety.
When these areas are under strain, communication can become more guarded and less transparent. Managers may hesitate to raise concerns, acknowledge mistakes, or challenge assumptions. Over time, this reduces the likelihood that problems are surfaced early, limits organizational learning, and increases the risk that issues are managed reactively rather than addressed at a system level.
Sustained insecurity, low trust, or diminished respect are also associated with increased stress and emotional strain. When managers operate in environments where they feel uncertain or undervalued, it can affect focus, engagement, and decision-making capacity, influencing both team stability and overall performance.
Strengthening these areas supports a culture where concerns are raised earlier, learning is continuous, and accountability is shared. It also aligns with recognized psychological health and safety expectations, reinforcing sound governance and structured oversight of workplace risk factors.
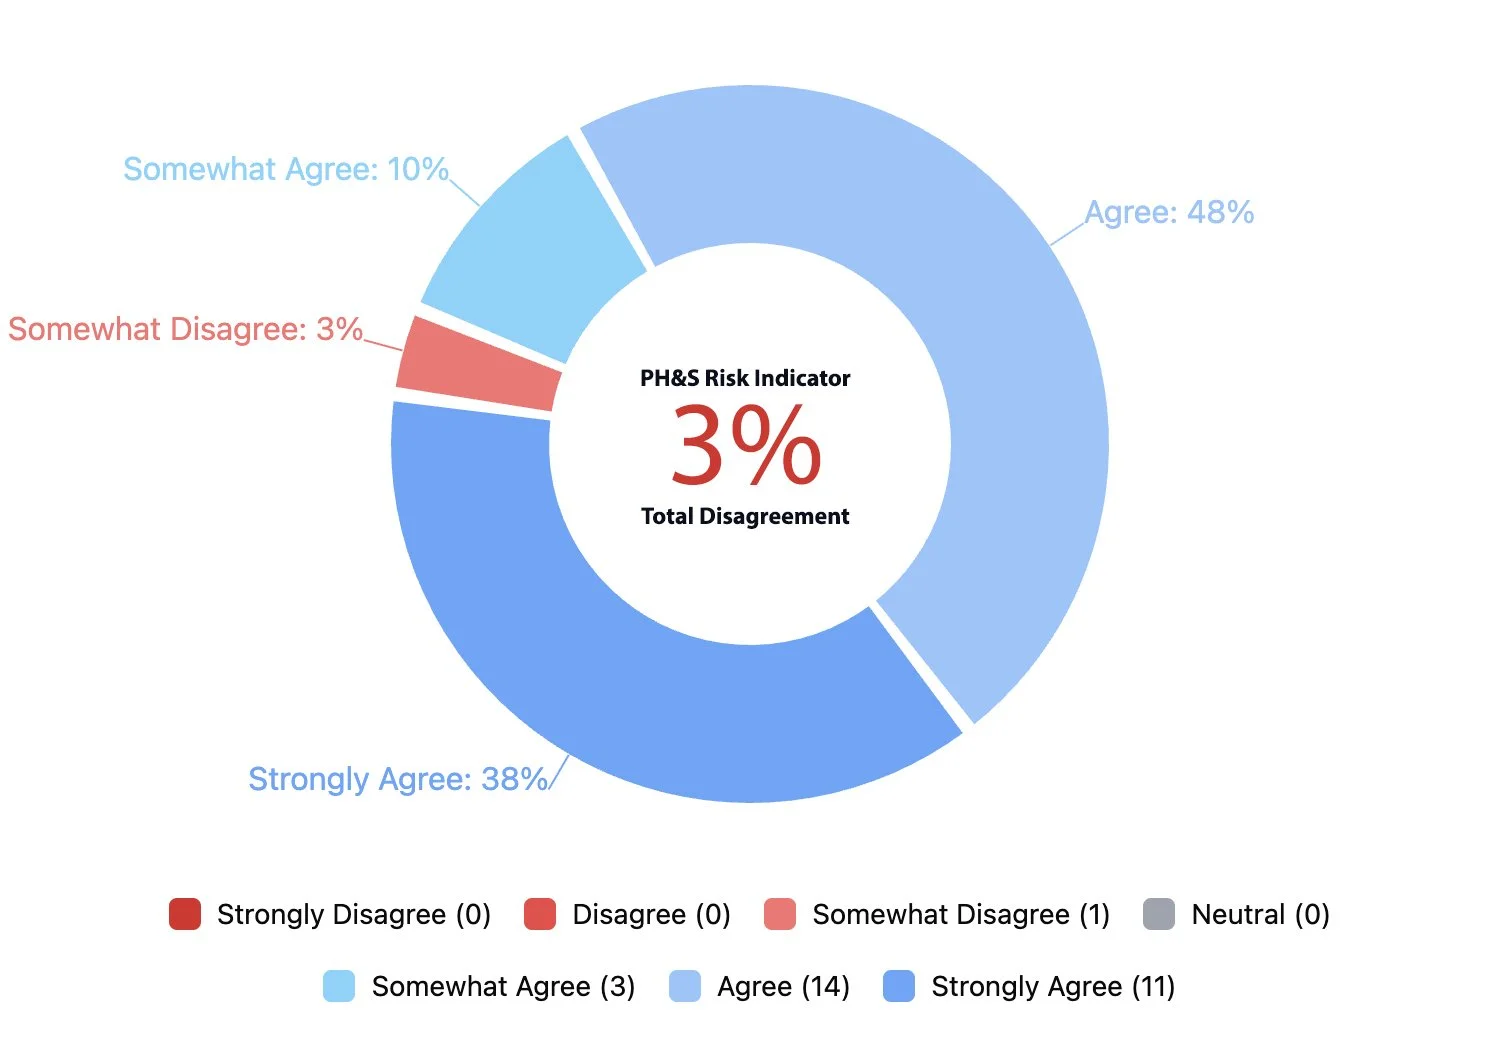
Physical Safety & Equipment Readiness
“My work environment is safe from physical hazards and I have adequate equipment (e.g. personal protective equipment, an ergonomic workspace) to do my job safely.” (Q16)
Average Weighted Response: 14 Risk Indicator: 3%
Psychological Health & Safety — Top Three Areas of Stability
Diverse Perspectives & Inclusion
“My workplace is made up of people who have diverse experiences and perspectives.” (Q6)
Average Weighted Response: 14 Risk Indicator: 3%
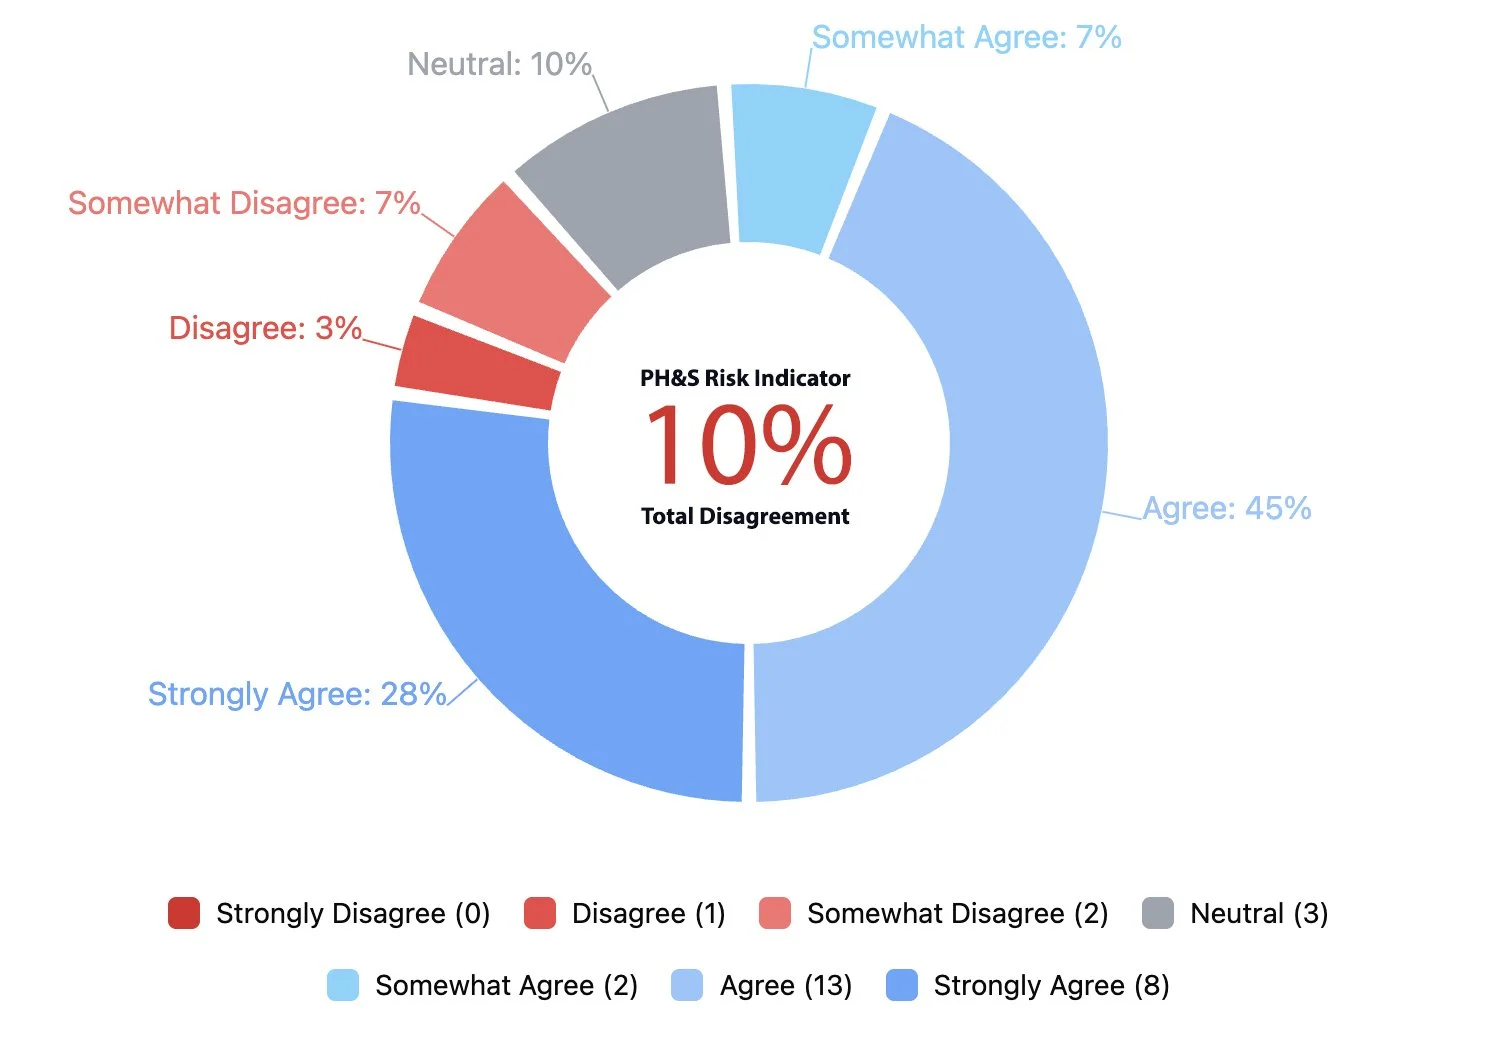
Clear Reporting Pathways & Behavioural Standards
“If I am being harassed, bullied or discriminated against at work, I know what to do and who to contact in my workplace.” (Q12)
Average Weighted Response: 22 Risk Indicator: 10%
*Average Weighted Response reflects overall severity across the full response distribution. PH&S Risk Indicator reflects the percentage selecting Somewhat Disagree / Disagree / Strongly Disagree.
Why this matters
Strengths in Physical Safety & Proper Equipment, Diverse Experiences and Perspectives, and Clear Reporting Pathways for Harassment, Bullying, and Discrimination reflect important foundations that support inclusion, clarity, and prevention across the workplace. These results indicate that leadership has established meaningful structures and safeguards aligned with recognized guidance under the Canadian National Standard, ISO 45003, and WorkSafeBC’s direction on psychological health and safety.
When these systems are functioning well, managers are better equipped to respond appropriately when concerns arise. Clear reporting pathways reduce ambiguity, inclusive environments support engagement, and strong physical safety practices reinforce confidence in organizational oversight.
These foundations create stability within the system. At the same time, research and practice consistently show that formal structures are most fully utilized when employees feel interpersonal safety. Where trust and respect are strong, reporting pathways and inclusion efforts tend to function as intended; where interpersonal risk feels elevated, employees may be slower to engage with otherwise well-designed systems.
As attention turns to strengthening areas such as trust, respect, and job security, maintaining these established strengths ensures that improvement efforts build on solid ground rather than compensating for gaps.
Sustaining these conditions supports consistent performance, reinforces governance expectations, and contributes to a balanced approach to risk mitigation and organizational effectiveness.
Human Capacity Signals (Mental Health)
In addition to workplace conditions, it is important to understand how managers are currently experiencing human capacity.
The Mental Health Signals reflect how frequently managers have experienced specific conditions over the past two weeks. These indicators provide context for overall capacity within the cohort.
Note that Signal Levels reflect the overall weighted frequency of this experience, converted to a number out of 100 for easier interpretation. High Strain Levels show the proportion of people reporting this more than half the days or nearly every day, while Extreme Strain Levels highlight those experiencing it nearly every day — helping us understand both the overall pattern and how concentrated the strain may be within the group.
Highest Frequency Indicators (risks)
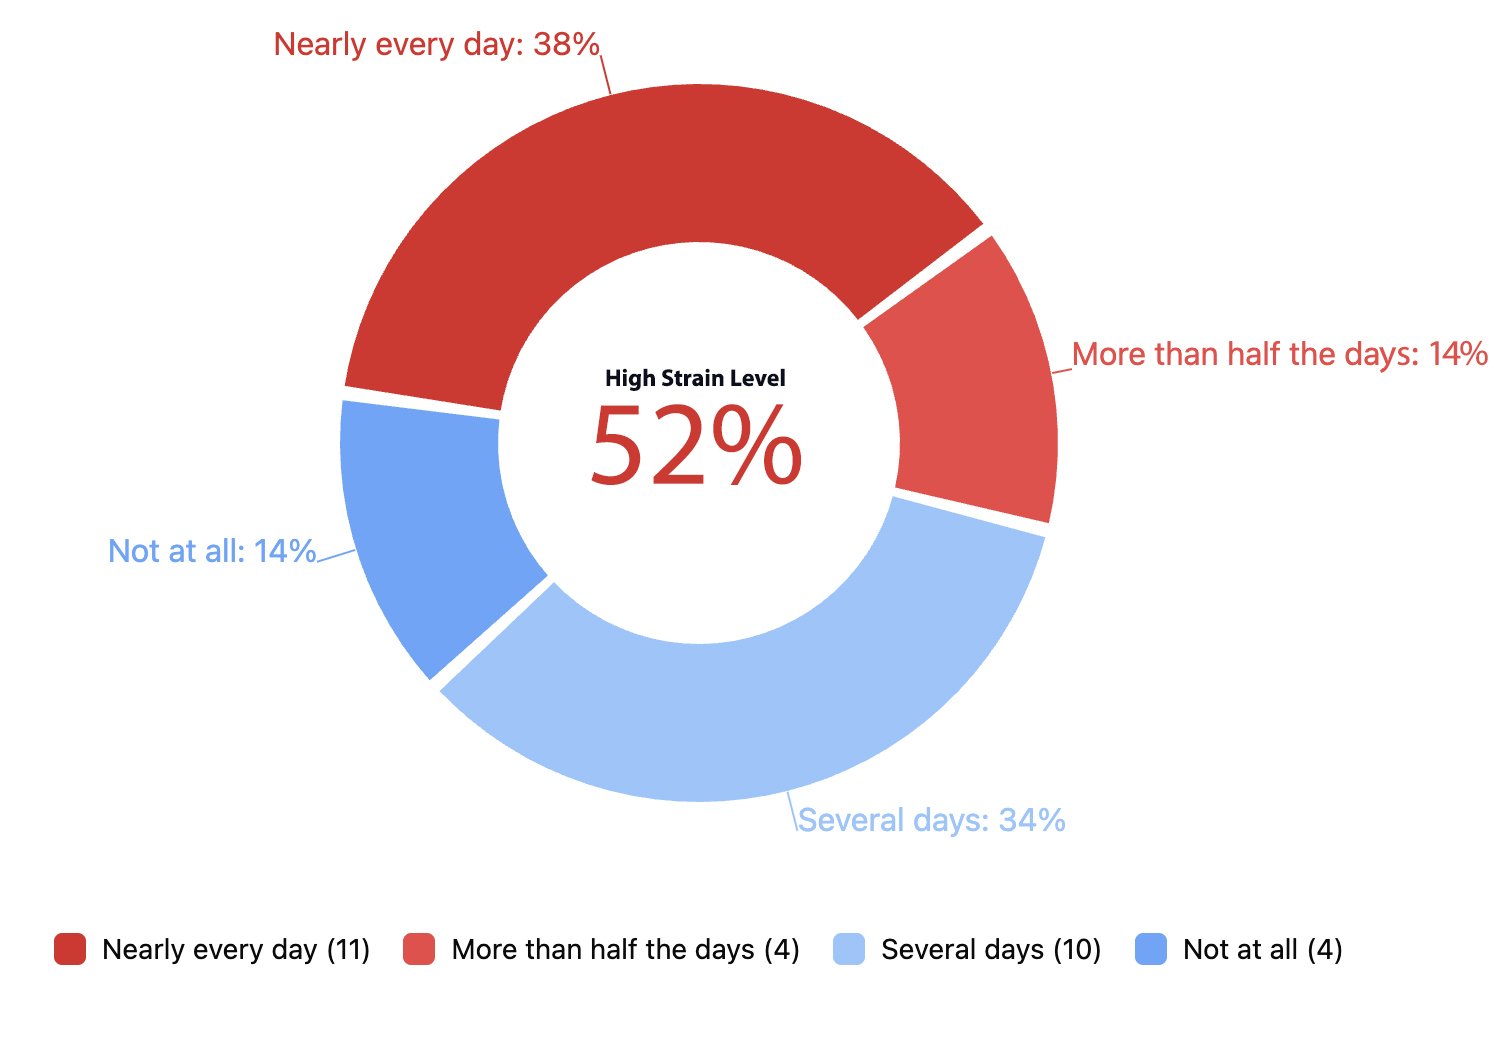
Stress
“Over the past two weeks, I have felt under a lot of pressure.” (Q19)
Signal Level: 59 High Strain Level: 52% Extreme Strain Level: 38%
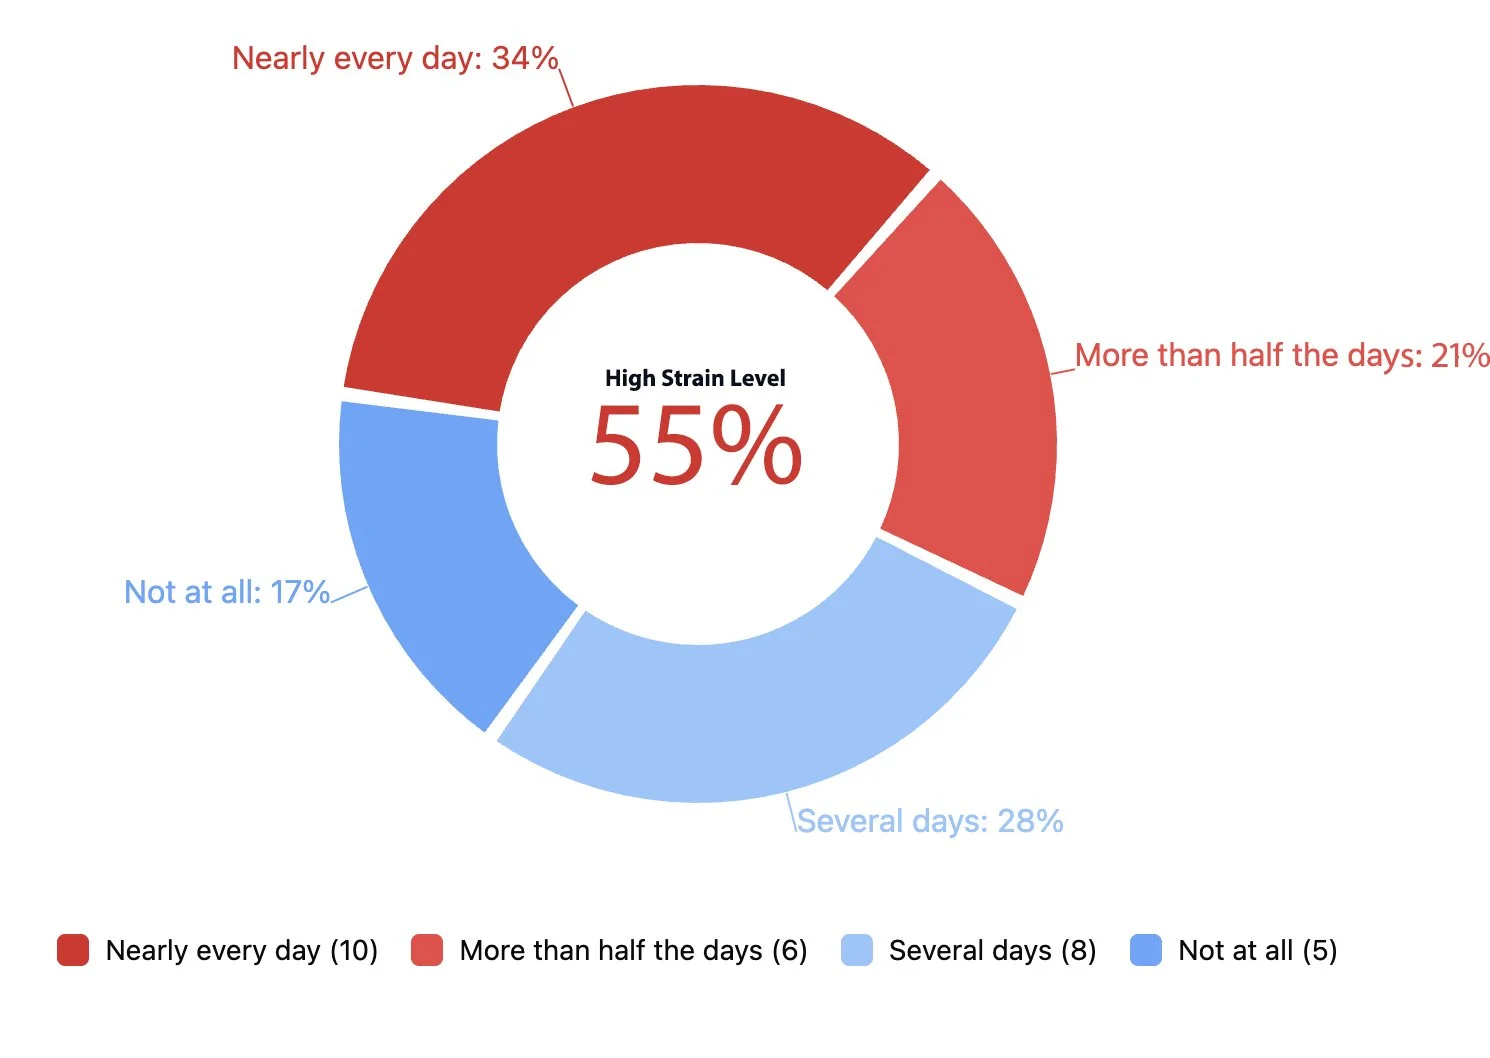
Burnout
“Over the past two weeks, thinking about my work has left me feeling exhausted.” (Q22)
Signal Level: 57 High Strain Level: 55% Extreme Strain Level: 34%
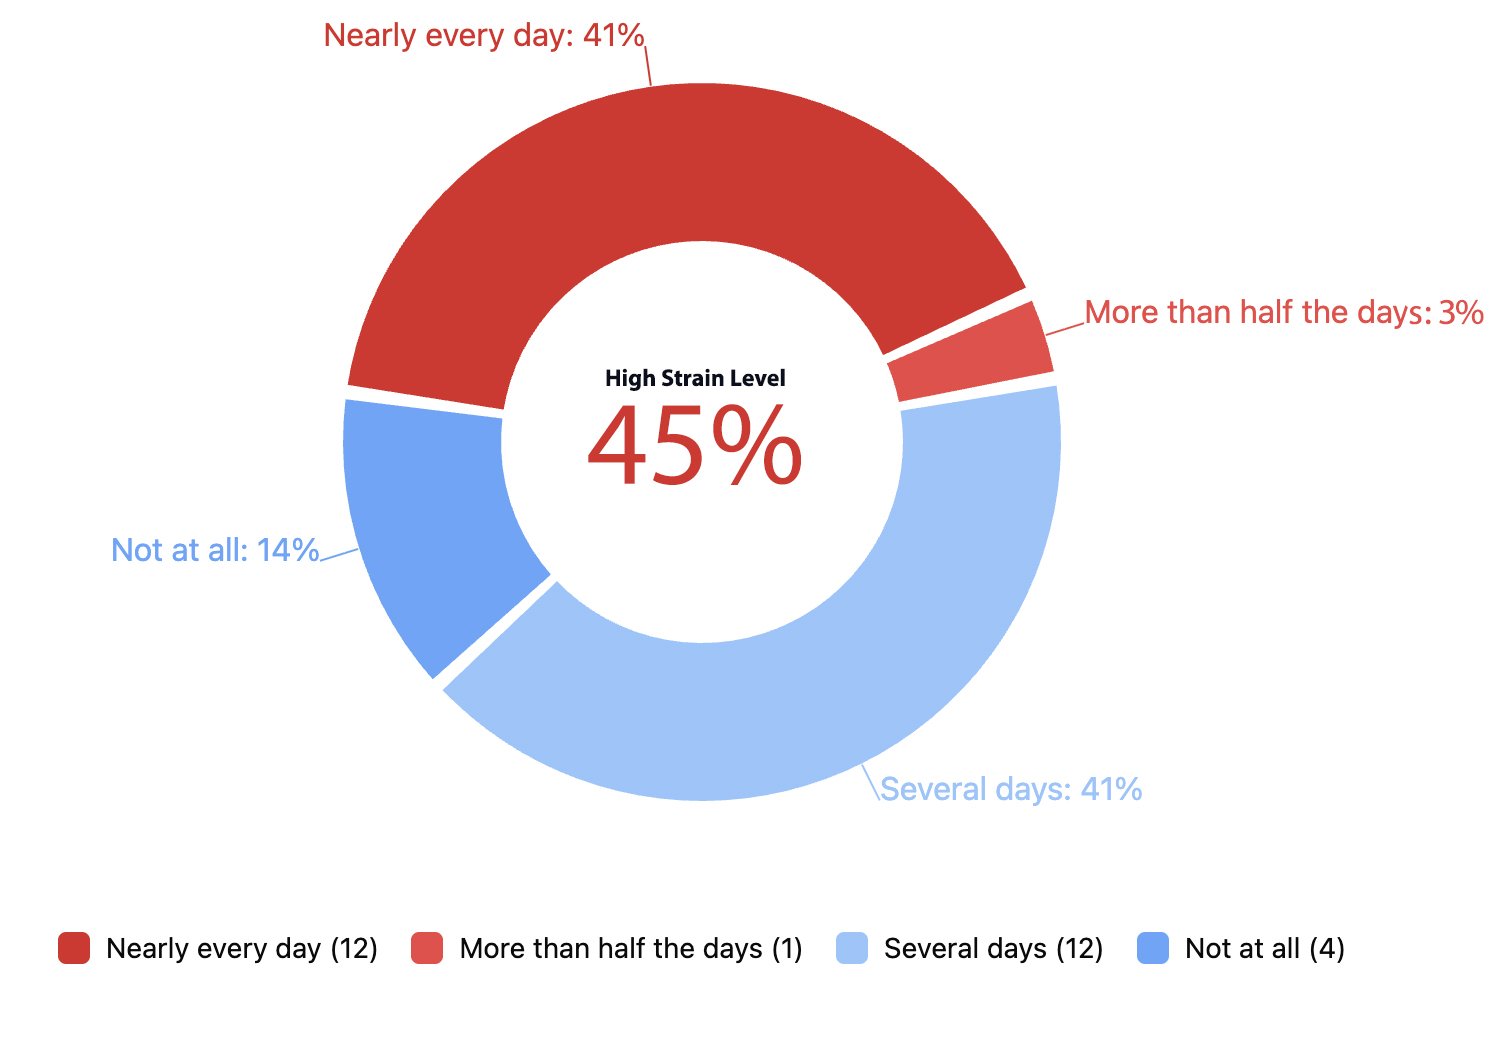
Worry
“Over the past two weeks, I have found myself worrying a lot.” (Q20)
Signal Level: 57 High Strain Level: 45% Extreme Strain Level: 41%
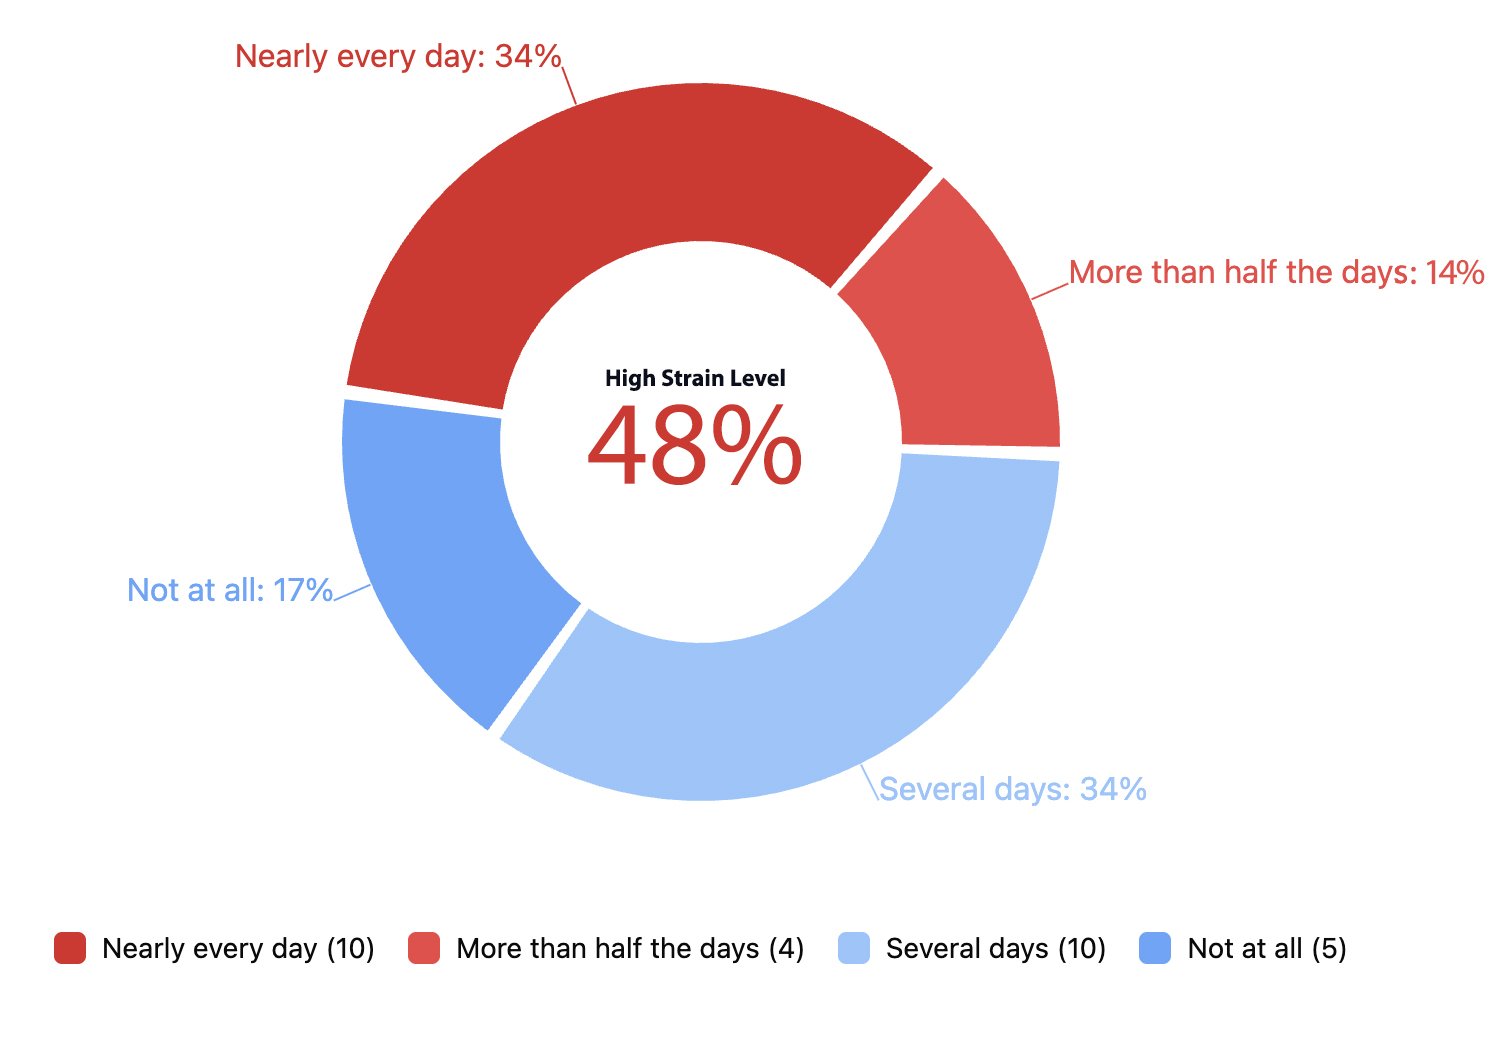
Anxiety
“Over the past two weeks, I have felt anxious or on edge.” (Q21)
Signal Level: 55 High Strain Level: 48% Extreme Strain Level: 34%
Why this Matters
Stress, Burnout, Worry, and Anxiety reflect the level of psychological load individuals may currently be carrying while doing their work. In the type of work reflected in this group, that load can include, among other things, exposure to trauma, complex client needs, emotionally demanding decisions, and system constraints. These experiences are shaped by both workplace conditions and factors outside of work (including personal responsibilities, financial pressures, and family relationships, etc.). While these conditions do not all originate in the workplace, the work environment plays an important role in either amplifying or easing that load through clarity, stability, leadership behaviours, and psychological safety.
Worry is often an early indicator. When persistent, it can evolve into sustained stress and heightened anxiety, increasing vulnerability to burnout. Early signs may include increased irritability, reduced patience, more frequent mistakes, withdrawal from colleagues, or growing cynicism toward work or clients. Communication can become more guarded, collaboration may narrow, and problem-solving can become more reactive. In a service-based environment, these patterns can influence both team cohesion and client outcomes.
The relationship is also reciprocal. Sustained stress and burnout can influence how workplace conditions are perceived, increasing sensitivity to leadership decisions and organizational policies. For this reason, Psychological Health & Safety conditions and Mental Health Signals are best interpreted together, as part of the same system.
These findings provide high-level directional insight rather than root-cause conclusions. Deeper examination of these signals, including the extent to which work conditions contribute, will help clarify where practical adjustments may have the greatest impact.
Areas of Strength and Resilience
Qualification
It’s important to interpret these mental health signals differently from PH&S risk indicators. In the PH&S model, a higher percentage reflects greater disagreement with positive workplace conditions and therefore greater system exposure. In contrast, mental health indicators reflect the proportion of individuals experiencing elevated strain. While lower levels of high strain in areas such as loneliness or depression are comparatively more stable relative to stress, worry, anxiety, or burnout, they do not suggest that any level of sustained distress is desirable. Ideally, fewer individuals would report experiencing strain more than half or nearly every day. These findings are therefore best understood as relative patterns within the cohort, helping leadership identify where pressure is most concentrated rather than labeling any condition as “positive” in absolute terms.
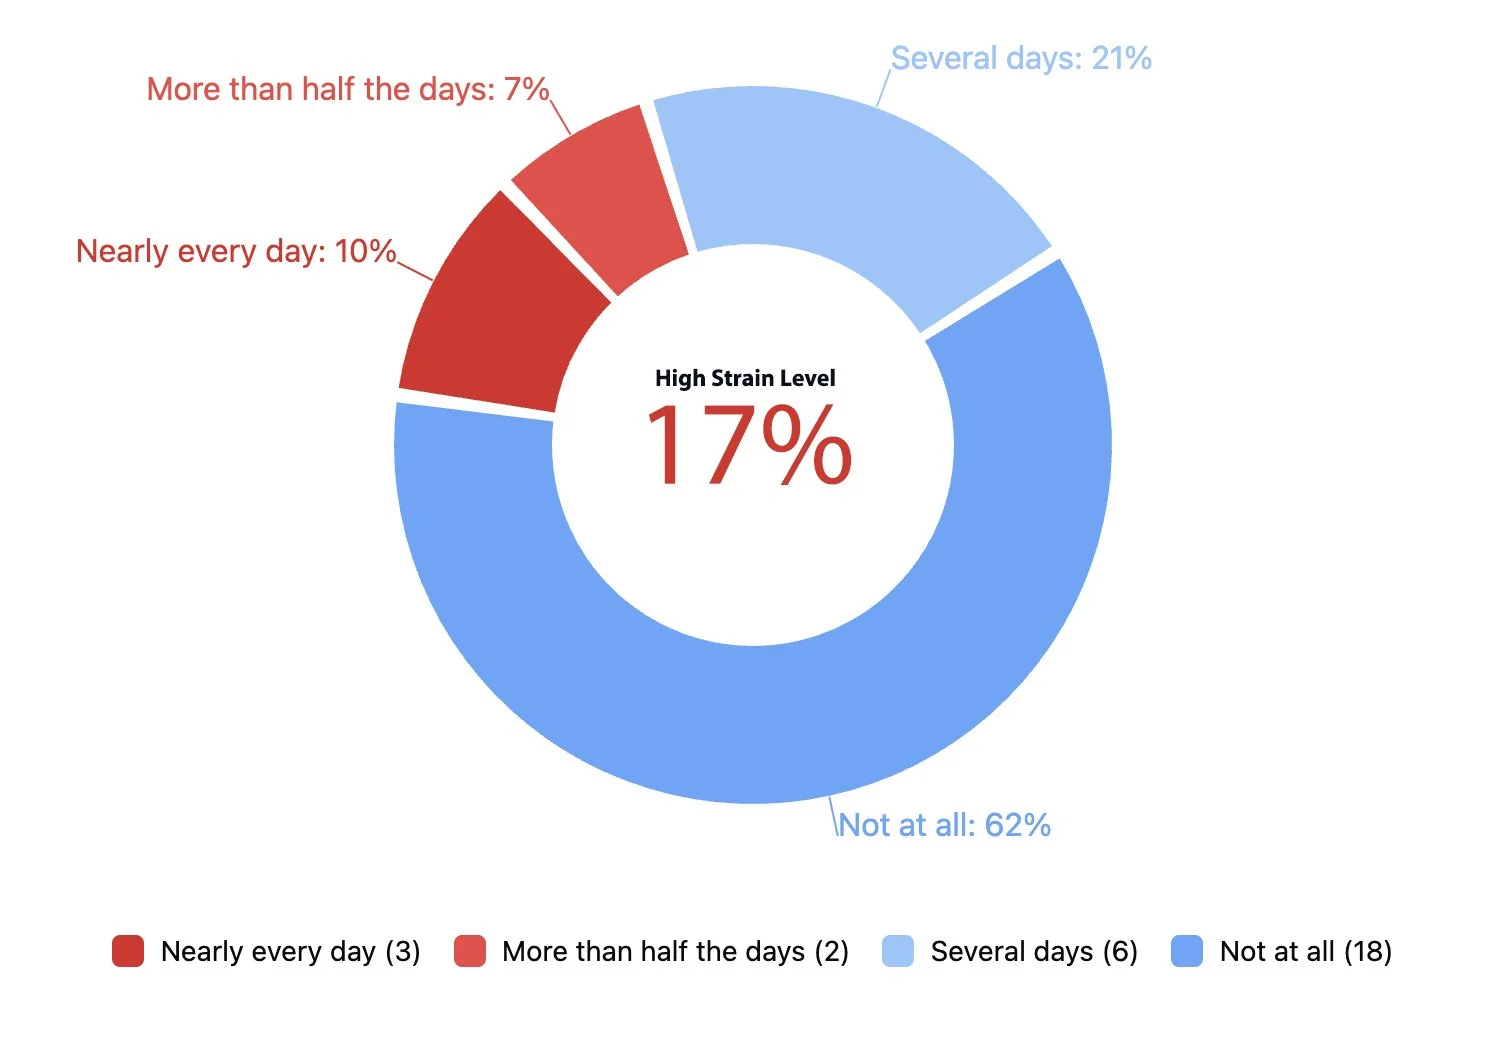
Depression
“Over the past two weeks, I have had less interest or pleasure in things I usually enjoy.” (Q24)
Signal Level: 22 High Strain Level: 17% Extreme Strain Level: 10%
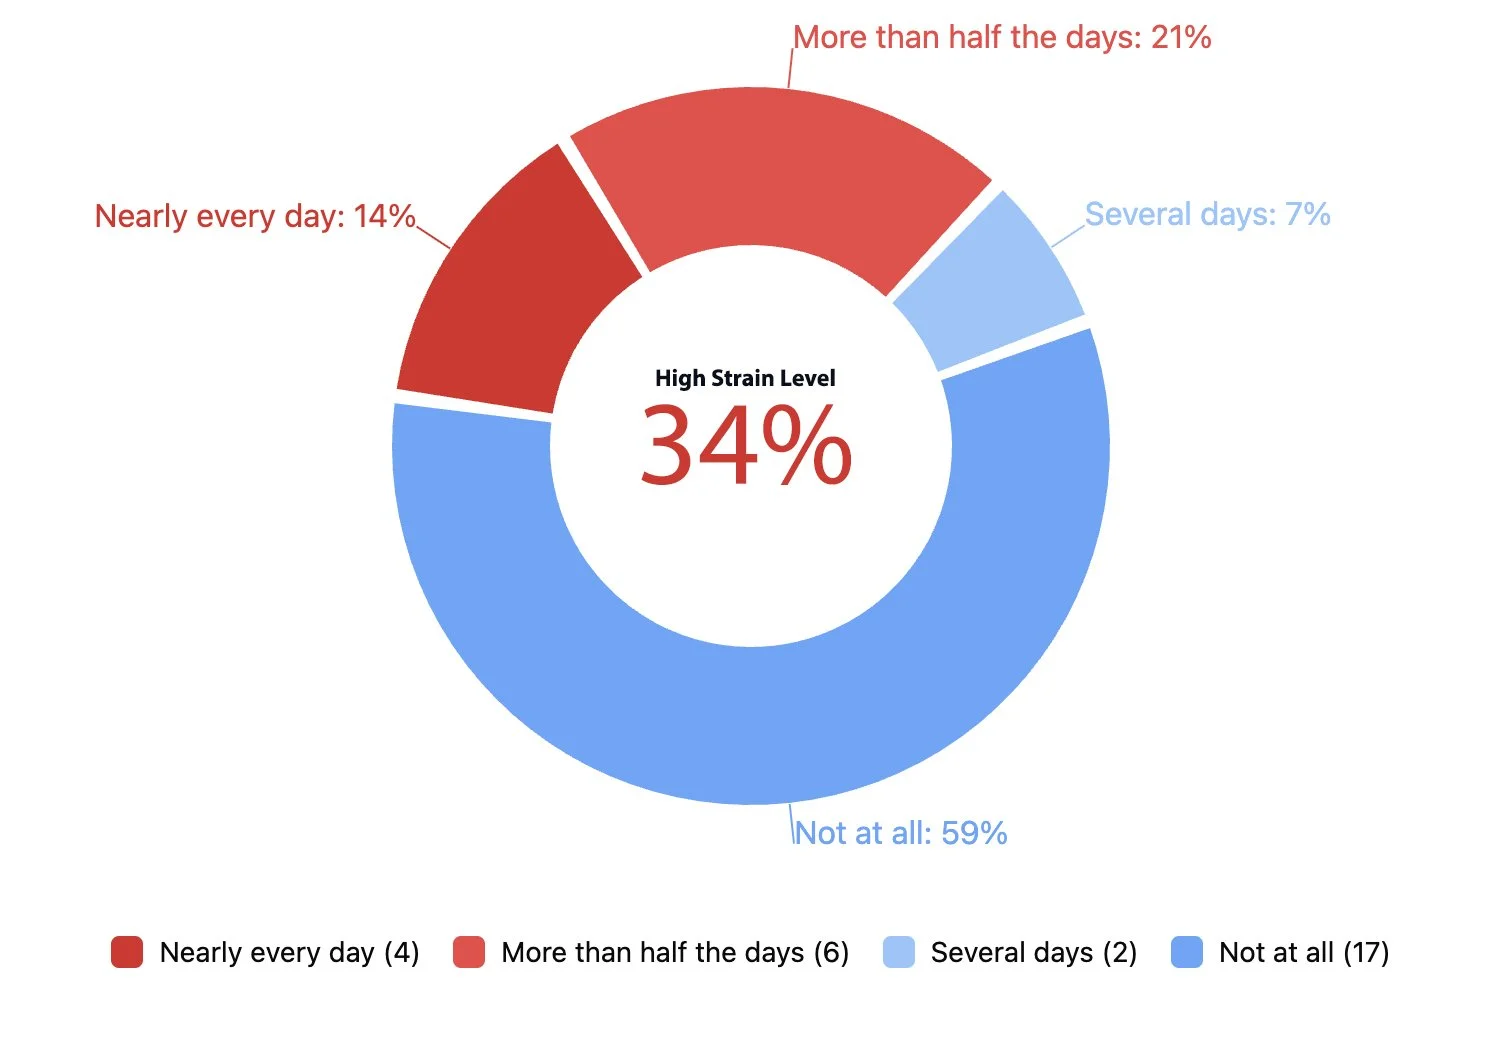
Loneliness & Isolation
“Over the past two weeks, I have felt lonely or isolated.” (Q23)
Signal Level: 30 High Strain Level: 34% Extreme Strain Level: 14%
Why it Matters
Positive signals in loneliness, isolation, and depression suggest that many managers feel socially connected and grounded in their work. This is particularly relevant in environments where roles may be geographically distributed, community-based, or carried out with a high degree of independence.
The experience of isolation is not uniform. Some individuals rely heavily on workplace connection for social engagement and meaning, while others draw more of that support from outside relationships and personal networks. External factors and individual resilience therefore play a significant role in how loneliness or depressive symptoms are experienced.
The nature of the work itself can also influence mental health. Exposure to trauma, complex client needs, and emotionally demanding situations can contribute to periods of sadness or strain, depending on the level of support available within teams and beyond the workplace. While organizations cannot control all external influences, they can shape the conditions within work, including connection, purpose, peer support, and leadership consistency.
The place where people work (alone, remotely, in office settings, or within community environments) affects how connected they feel. Strengthening intentional connection and reinforcing shared purpose can contribute meaningfully to stability, even when external pressures exist.
Interpreting the System Together
When we look at workplace conditions (PH&S) and mental health signals together, we get a more complete picture of how the organization is functioning (and how employees are functioning within it). If both system risk and employee strain are elevated at the same time, that can indicate that workplace conditions may be adding to ongoing stress. While psychological health and safety and mental health are interconnected, they are not the same. Individuals influence their own well-being, while the organization shapes the conditions in which that well-being is experienced at work. When workplace systems, relationships, and operational realities align well, unnecessary pressure is reduced, which can help create an environment where people are better positioned to manage stress, worry, or anxiety, even when some factors remain outside organizational control.
The Complete Data Table
To view results across all 17 PH&S areas and Mental Health responses, the complete data set is presented in table form.
Where Risk is Most Concentrated
When reviewing the full set of results, it is clear that not all PH&S conditions carry equal weight. Some areas register higher severity and broader disagreement, while others contribute less to overall exposure.
To better understand where attention may have the greatest impact, we examine Organizational Contribution. This analysis looks at the percentage each PH&S condition contributes to the total risk exposure across all 17 items.
Organizational Contribution
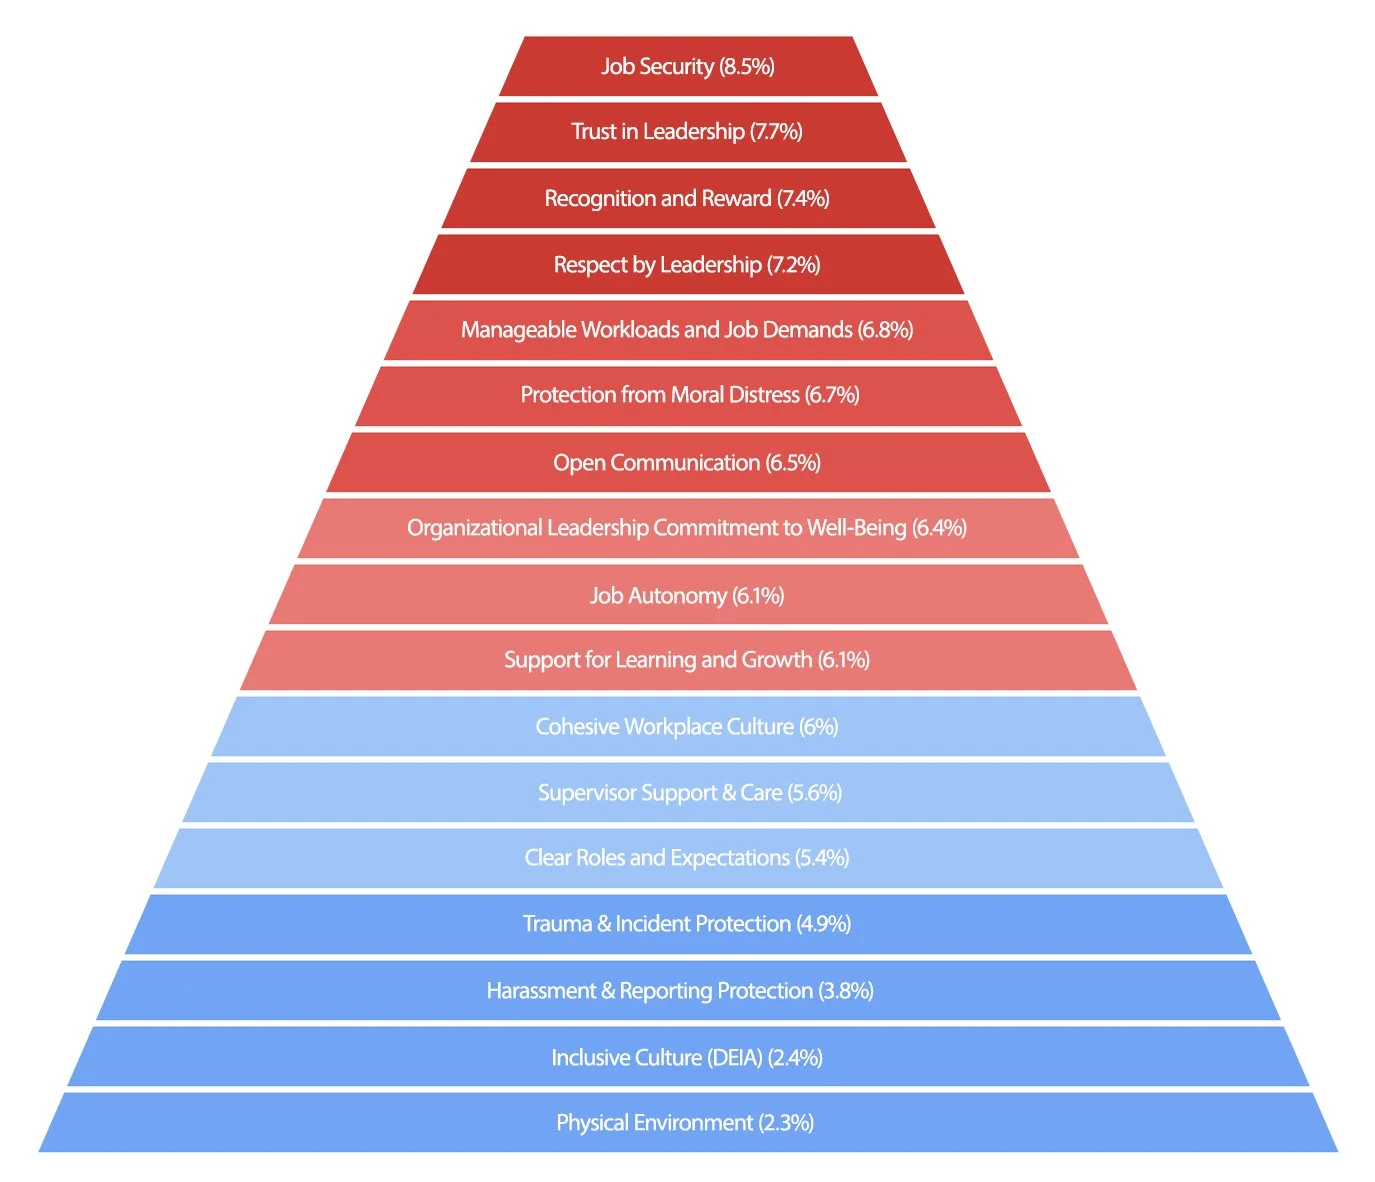
When we examine contribution, where risk is concentrated, we see strong alignment with our earlier results, but with one important note.
Across weighted averages and organizational contribution, Recognition and Reward ranks within the top three drivers of overall exposure. However, when we look at the breadth of disagreement (PH&S Risk Indicator), Respect by Leadership rises more strongly, indicating a wider share of managers actively signaling concern in that area.
Because the values across these top conditions are close, we have highlighted Job Security / Stability, Trust in Leadership, and Respect by Leadership as the primary focus areas in this report. This reflects our choice to place greater interpretive weight on the Risk Indicator when identifying priority areas, as it reflects how many managers are actively disagreeing with the statement.
The fact that Recognition and Reward ranks highly in contribution reinforces the value of the three-lens approach. Each lens answers a different question and together they help leadership make a more informed decision about where to focus first. As a result, it may be appropriate to consider Recognition and Reward as an area of focus.
Organizational Baseline
It is helpful to understand where the organization, or in this case the management cohort, stands across all PH&S components. This baseline provides a reference point for measuring change over time.
Across Questions 1–17, the Organizational PH&S Risk Level is 35 (out of 100). This represents the weighted average of all PH&S responses, converted to a 0–100 scale for clarity and consistency over time.
The Organizational PH&S Risk Indicator is 25%, meaning one in four managers selected Somewhat Disagree, Disagree, or Strongly Disagree on one or more PH&S conditions — actively signaling concern.
We present both measures together because they show different aspects of exposure. The Risk Level reflects the overall weighted response pattern across the cohort. The Risk Indicator reflects the breadth of visible disagreement — how many managers are expressing concern.
Together, these numbers establish a clear and measurable baseline. Over time, we would expect both to decrease. Movement in the Risk Indicator is particularly important, as it reflects a reduction in the number of managers experiencing conditions that may contribute to operational strain.
Next Steps
Before deciding what to do next, it is worth pausing on what this data already tells us.
Sixty percent of managers chose to participate. The Measurement Readiness score of 88 tells us clearly that this group believes this work is important and supports continued reflection around Psychological Health & Safety and Mental Health. That level of engagement matters, and it suggests this team has responded well to this initiative.
We have identified clear areas of elevated exposure, and we have also identified areas of stability. We have examined how workplace conditions and mental health signals may be interacting within this cohort.
From here, leadership can decide where to focus first. That may mean selecting one of the PH&S areas such as Job Security / Stability, Trust, Respect, or Recognition. It may mean focusing on Mental Health Signals, where Worry, Stress, Anxiety, and Burnout share common themes and may warrant concentrated attention.
Whichever direction is chosen, it will be informed by data. The areas now identified represent the greatest exposure and therefore the greatest opportunity for meaningful impact. Concentrating effort in the right place increases the likelihood that resources produce measurable movement rather than being dispersed across multiple initiatives.
We also now have a baseline. That baseline allows leadership to measure progress over time.
The next step is to select one area for focused attention, informed by the data in this report and by leadership’s formal and informal insights, which provide important context to these findings. However, one immediate next step is to respond to the managers. The data suggests that trust, respect, and recognition are areas of concern. A timely communication that acknowledges participation, reinforces that their opinions matter, and clearly outlines what will happen next will begin to address those conditions directly. The communication should be specific and may include selected findings from the survey. Taking this step promptly signals that engagement leads to action. From here, leadership determines the direction. The data has narrowed the field. There is an opportunity now to focus deliberately in the area where attention is most likely to create meaningful impact and measurable improvement over time.